Colorado's chronic absenteeism pattern has a center of gravity, and it sits squarely in high school. In 2024-25, every grade from 9th through 12th exceeded 30% chronic absenteeism. The average across those four grades was 36.3%, more than half again as high as the elementary average of 24.0%. The younger grades told a different story: kindergarten through 2nd grade all improved year over year.
The gradient is remarkably consistent. Third and fourth grade share the low point at 23.2%, and rates climb steadily from there, with only a small dip between 8th and 9th grade, until 12th grade peaks at 41.2%. More than 102,000 high school students were chronically absent last year, accounting for 40% of Colorado's total chronically absent population despite representing 32% of enrollment.
The staircase
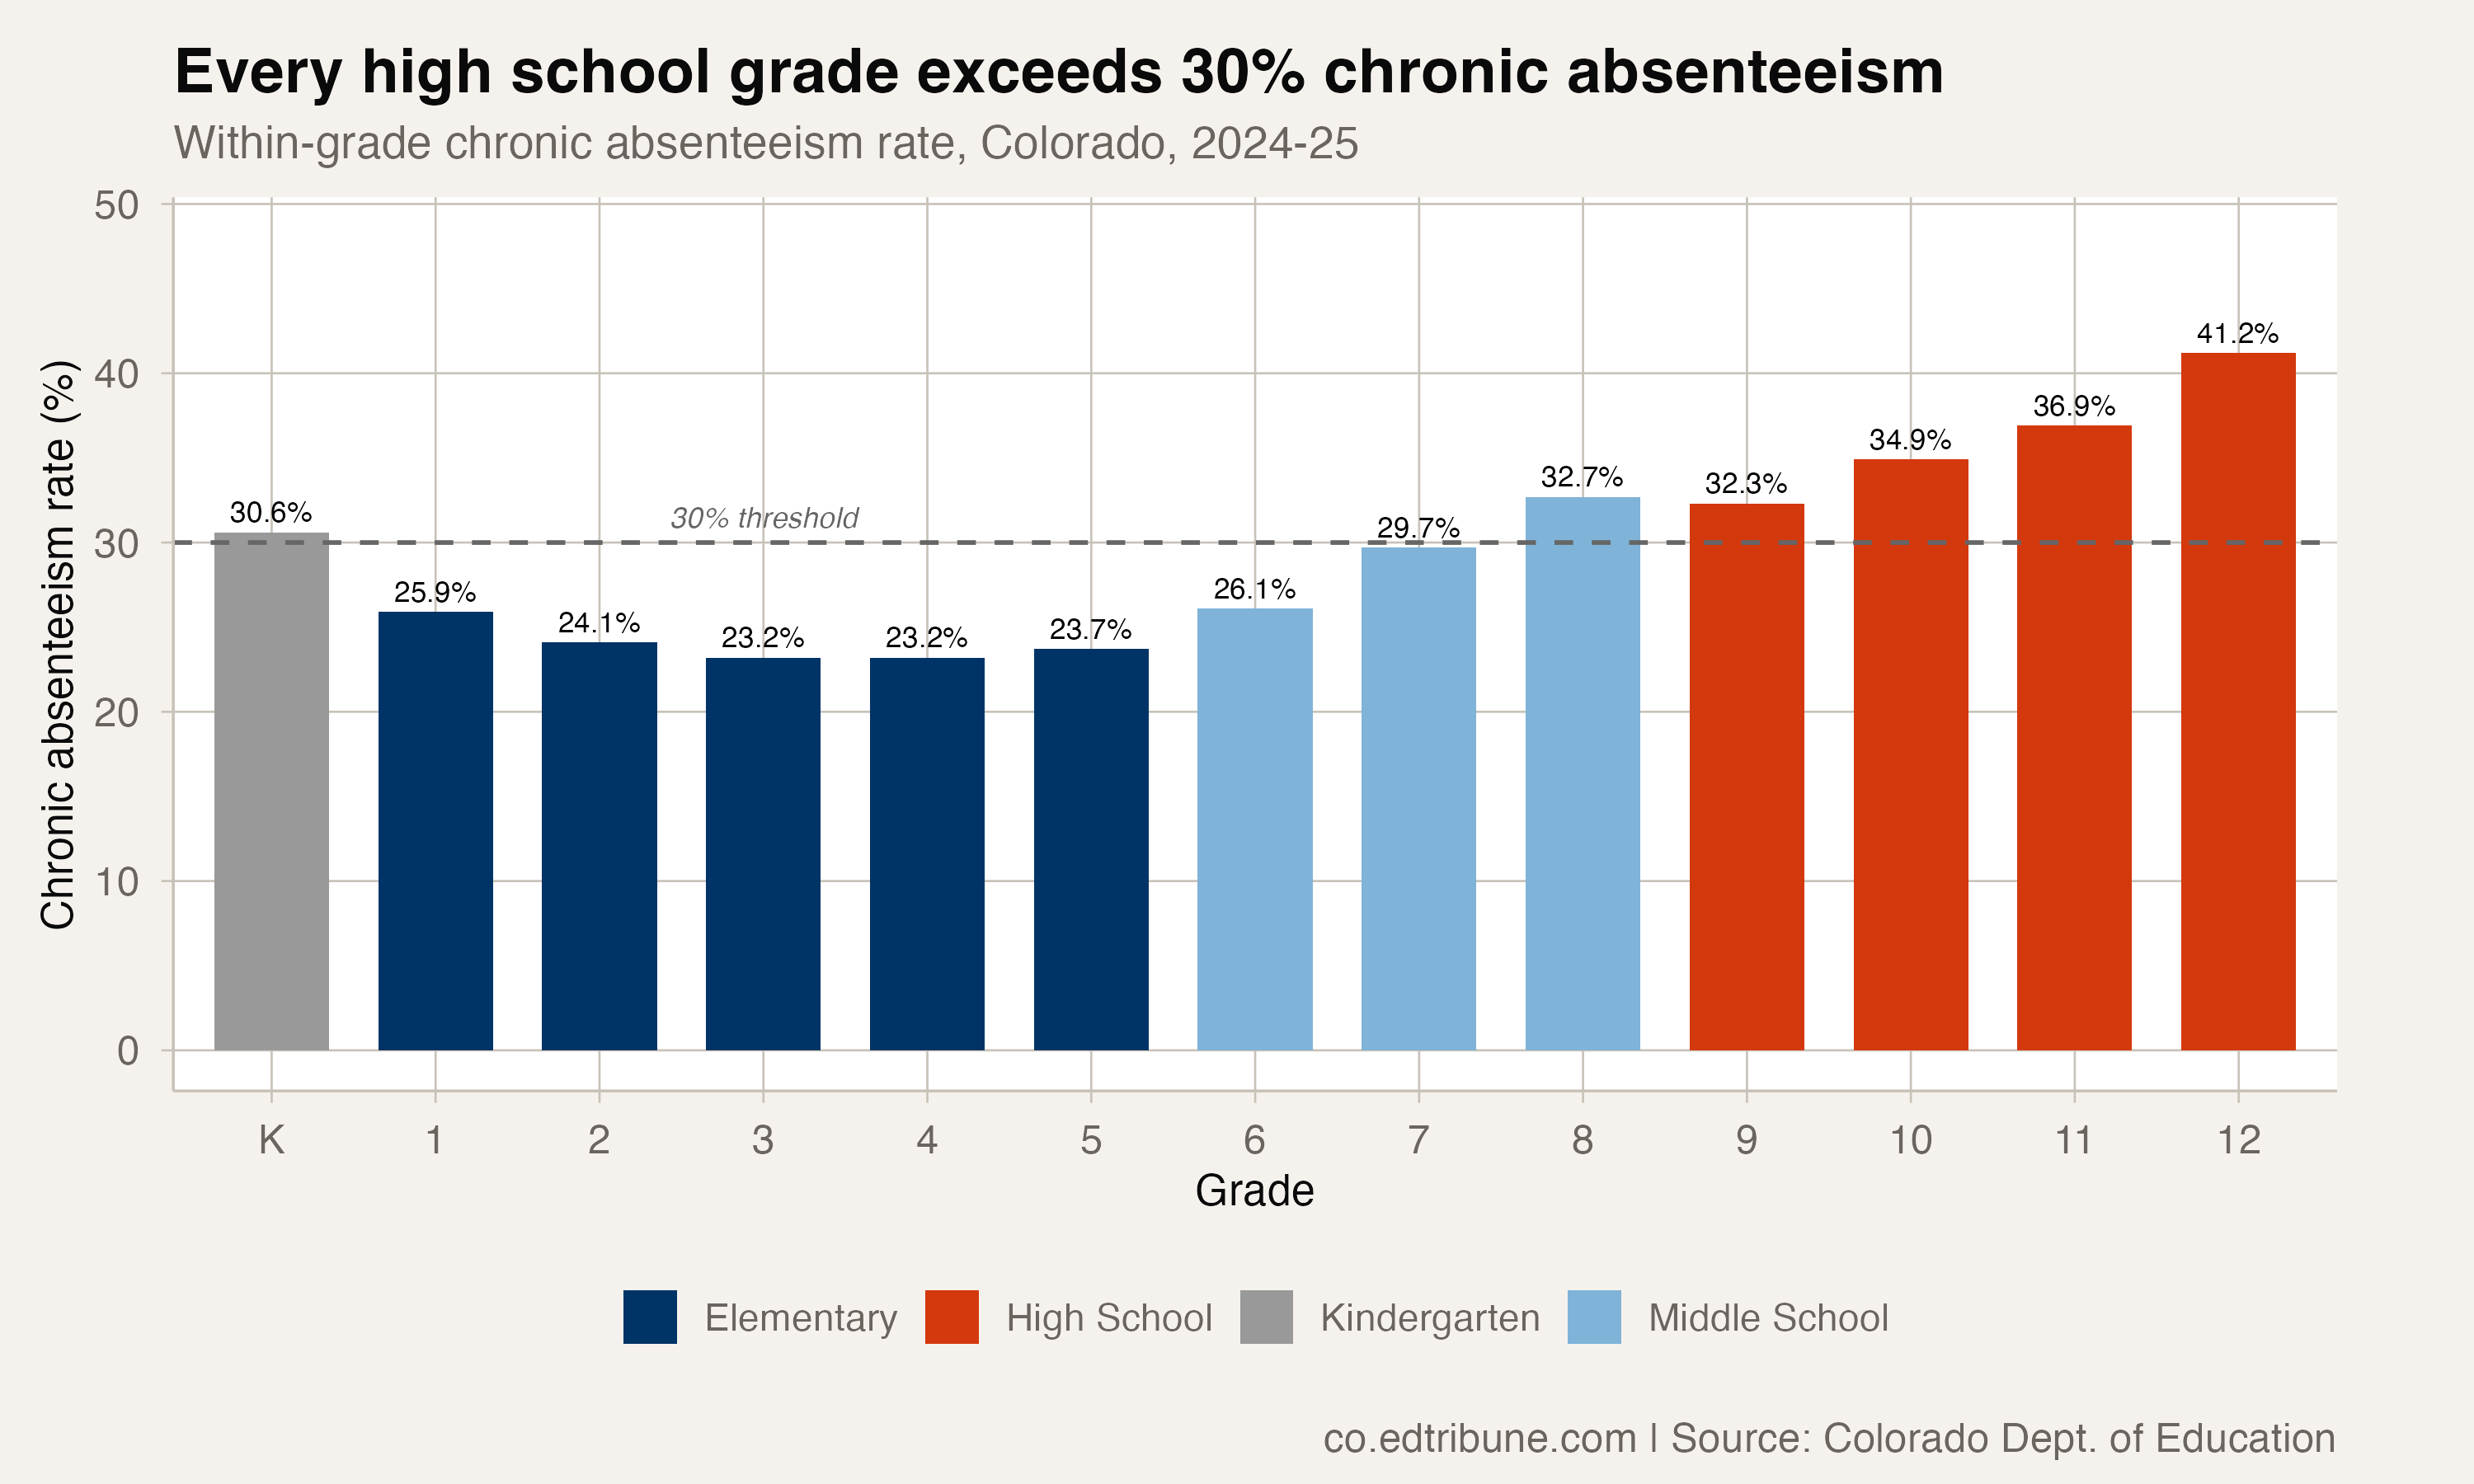
The grade-level data divides cleanly into three tiers. Elementary school (grades 1-5) averages 24.0%, with individual grades ranging from 23.2% to 25.9%. Middle school (grades 6-8) averages 29.5%, with 8th grade already above the 30% threshold at 32.7%. High school (grades 9-12) averages 36.3%, with 12th grade approaching the point where a majority of students are chronically absent.
Kindergarten sits outside this gradient at 30.6%, higher than any grade from 1st through 7th. The K rate likely reflects families treating the year as less compulsory, despite Colorado's universal full-day kindergarten program.
The steady climb from 3rd grade through 12th suggests this is not primarily a high school problem. It is a disengagement curve that begins in the later elementary years, steepens through middle school, and reaches its peak in the senior year. By the time a student reaches high school, the attendance patterns have been building for years.
Where the problem got worse
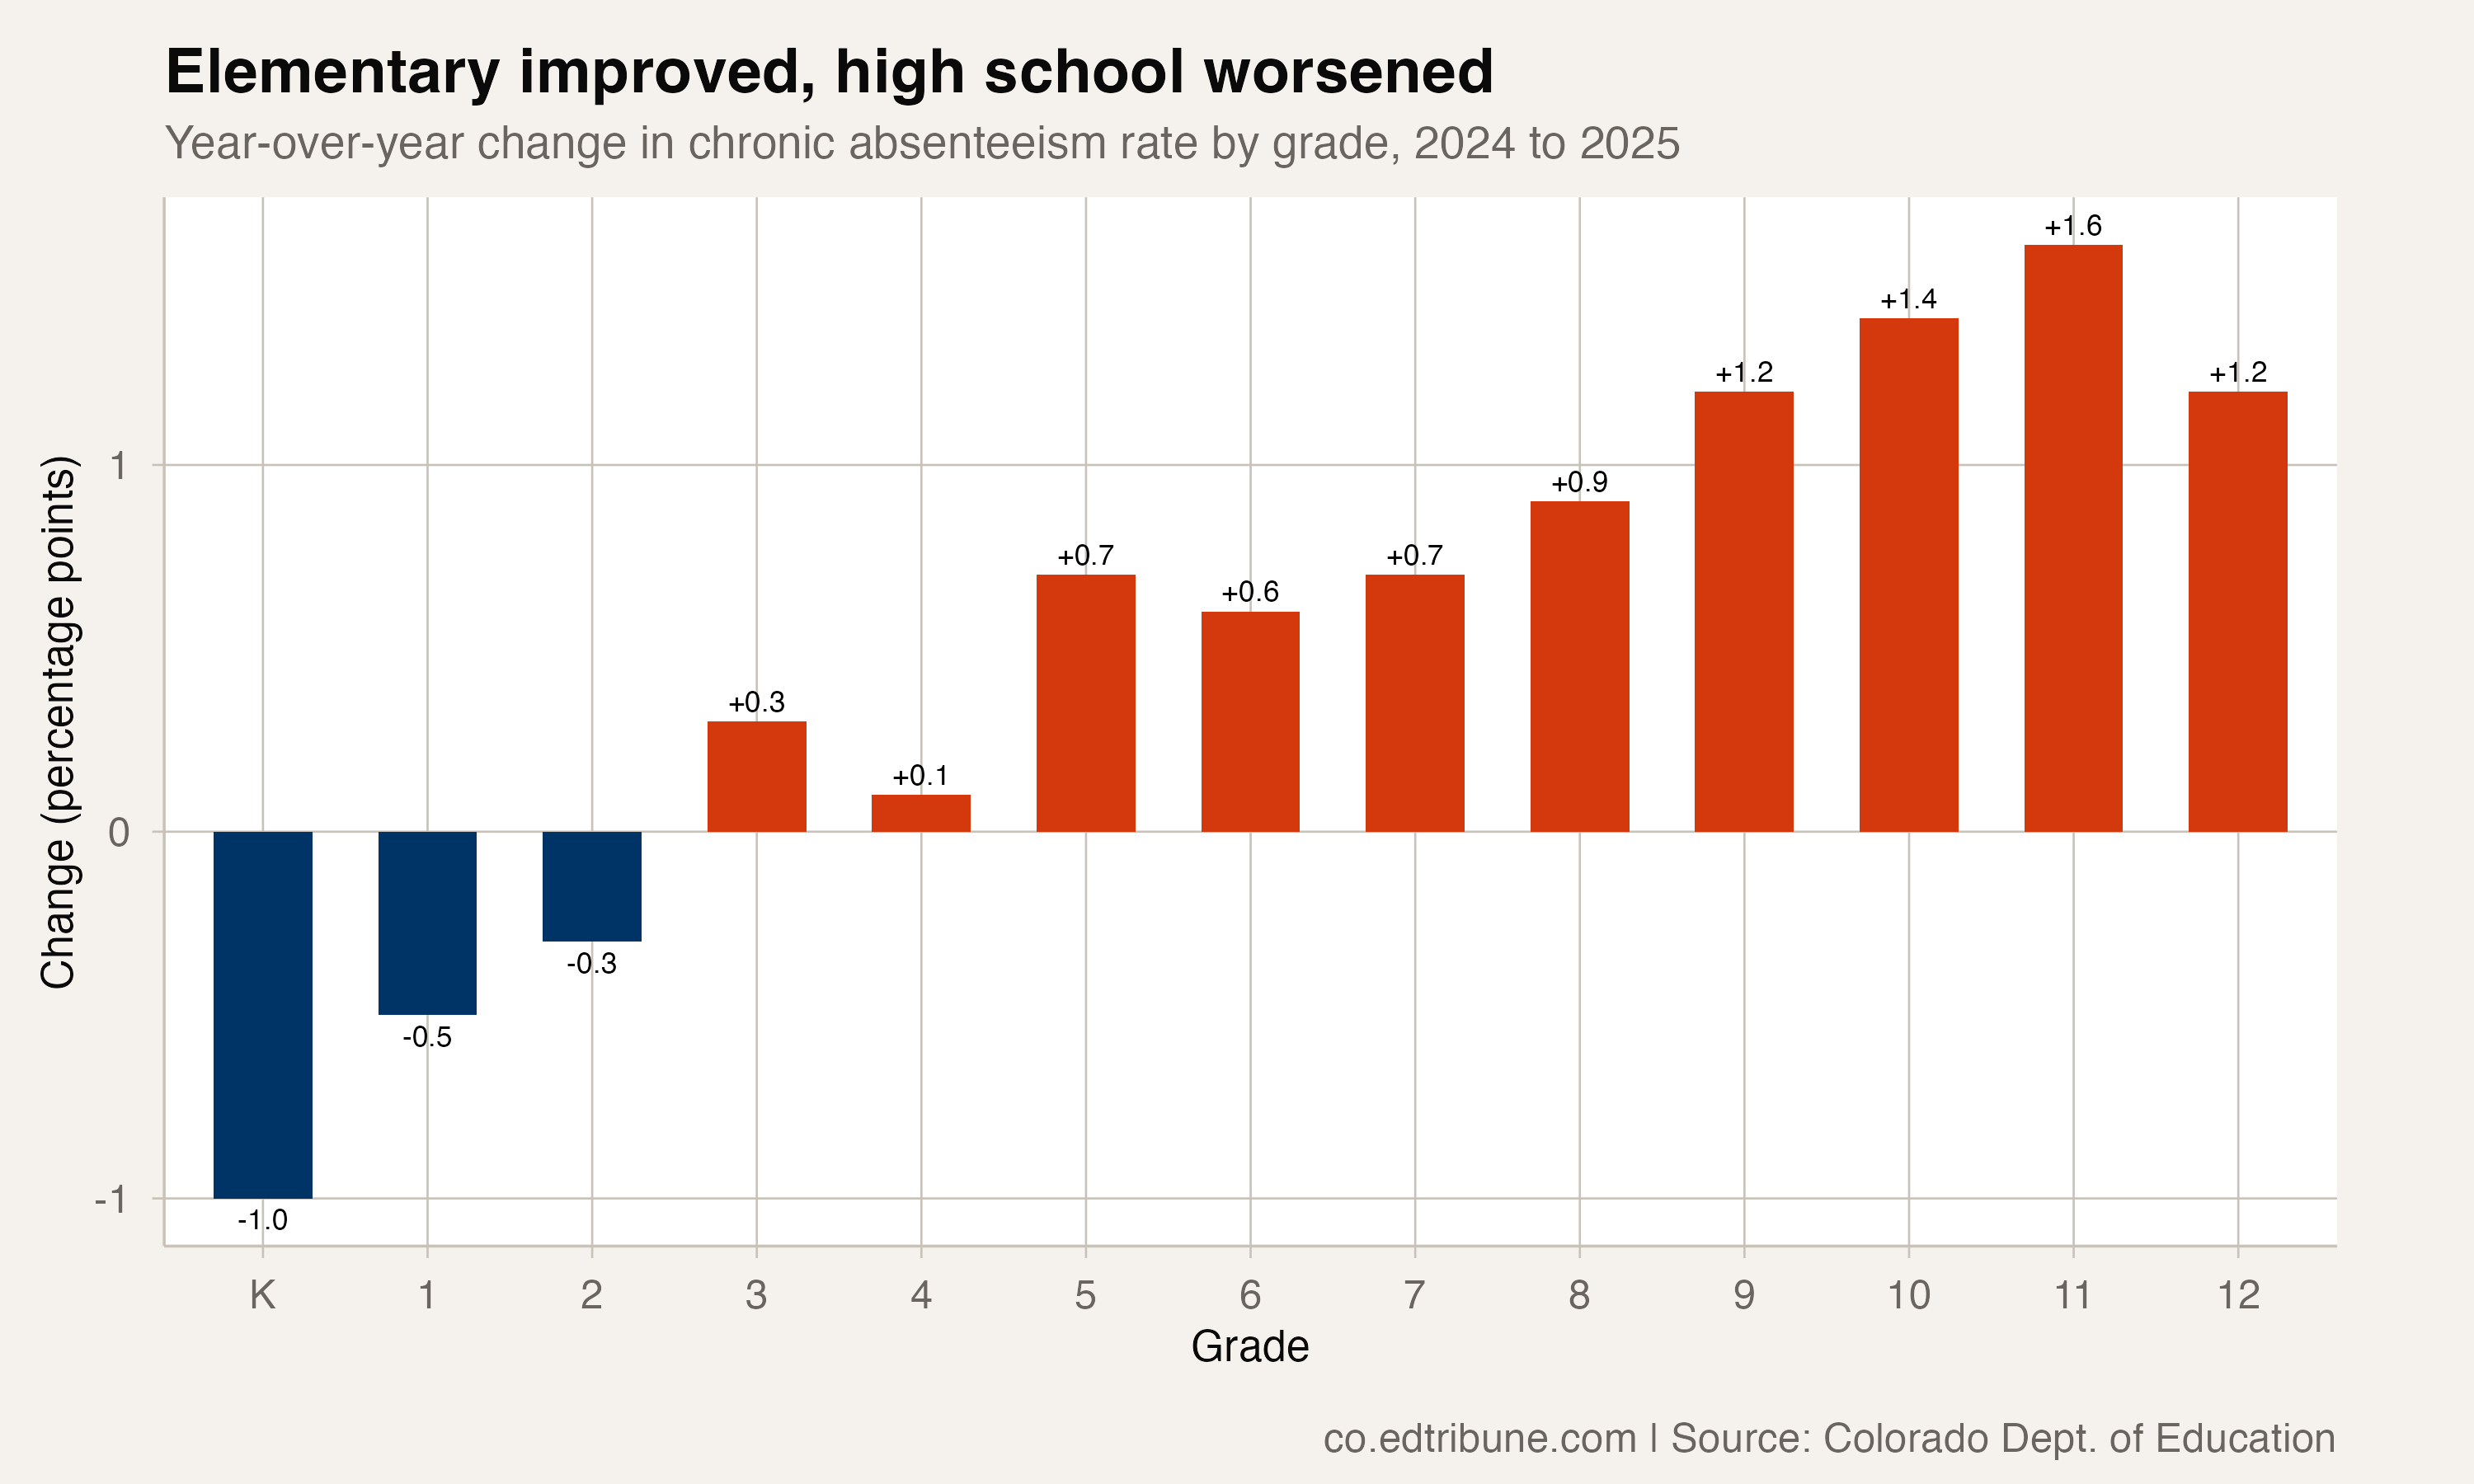
The 2024-25 data shows a divergence between grade levels that should concern anyone focused on Colorado's trajectory. Grades 1 and 2 improved slightly, dropping 0.5 and 0.3 percentage points. Kindergarten fell a full point. These are small but positive signals from the youngest students.
High school went the other direction entirely. Every grade worsened. Ninth grade rose 1.2 points. Tenth grade, 1.4 points. Eleventh grade posted the largest increase at 1.6 points. Twelfth grade climbed 1.2 points to 41.2%.
The middle school grades also worsened, with 8th grade up 0.9 points, but the increases were smaller than in high school. The pattern is clear: the older the student, the more likely chronic absenteeism worsened in 2024-25.
The volume problem
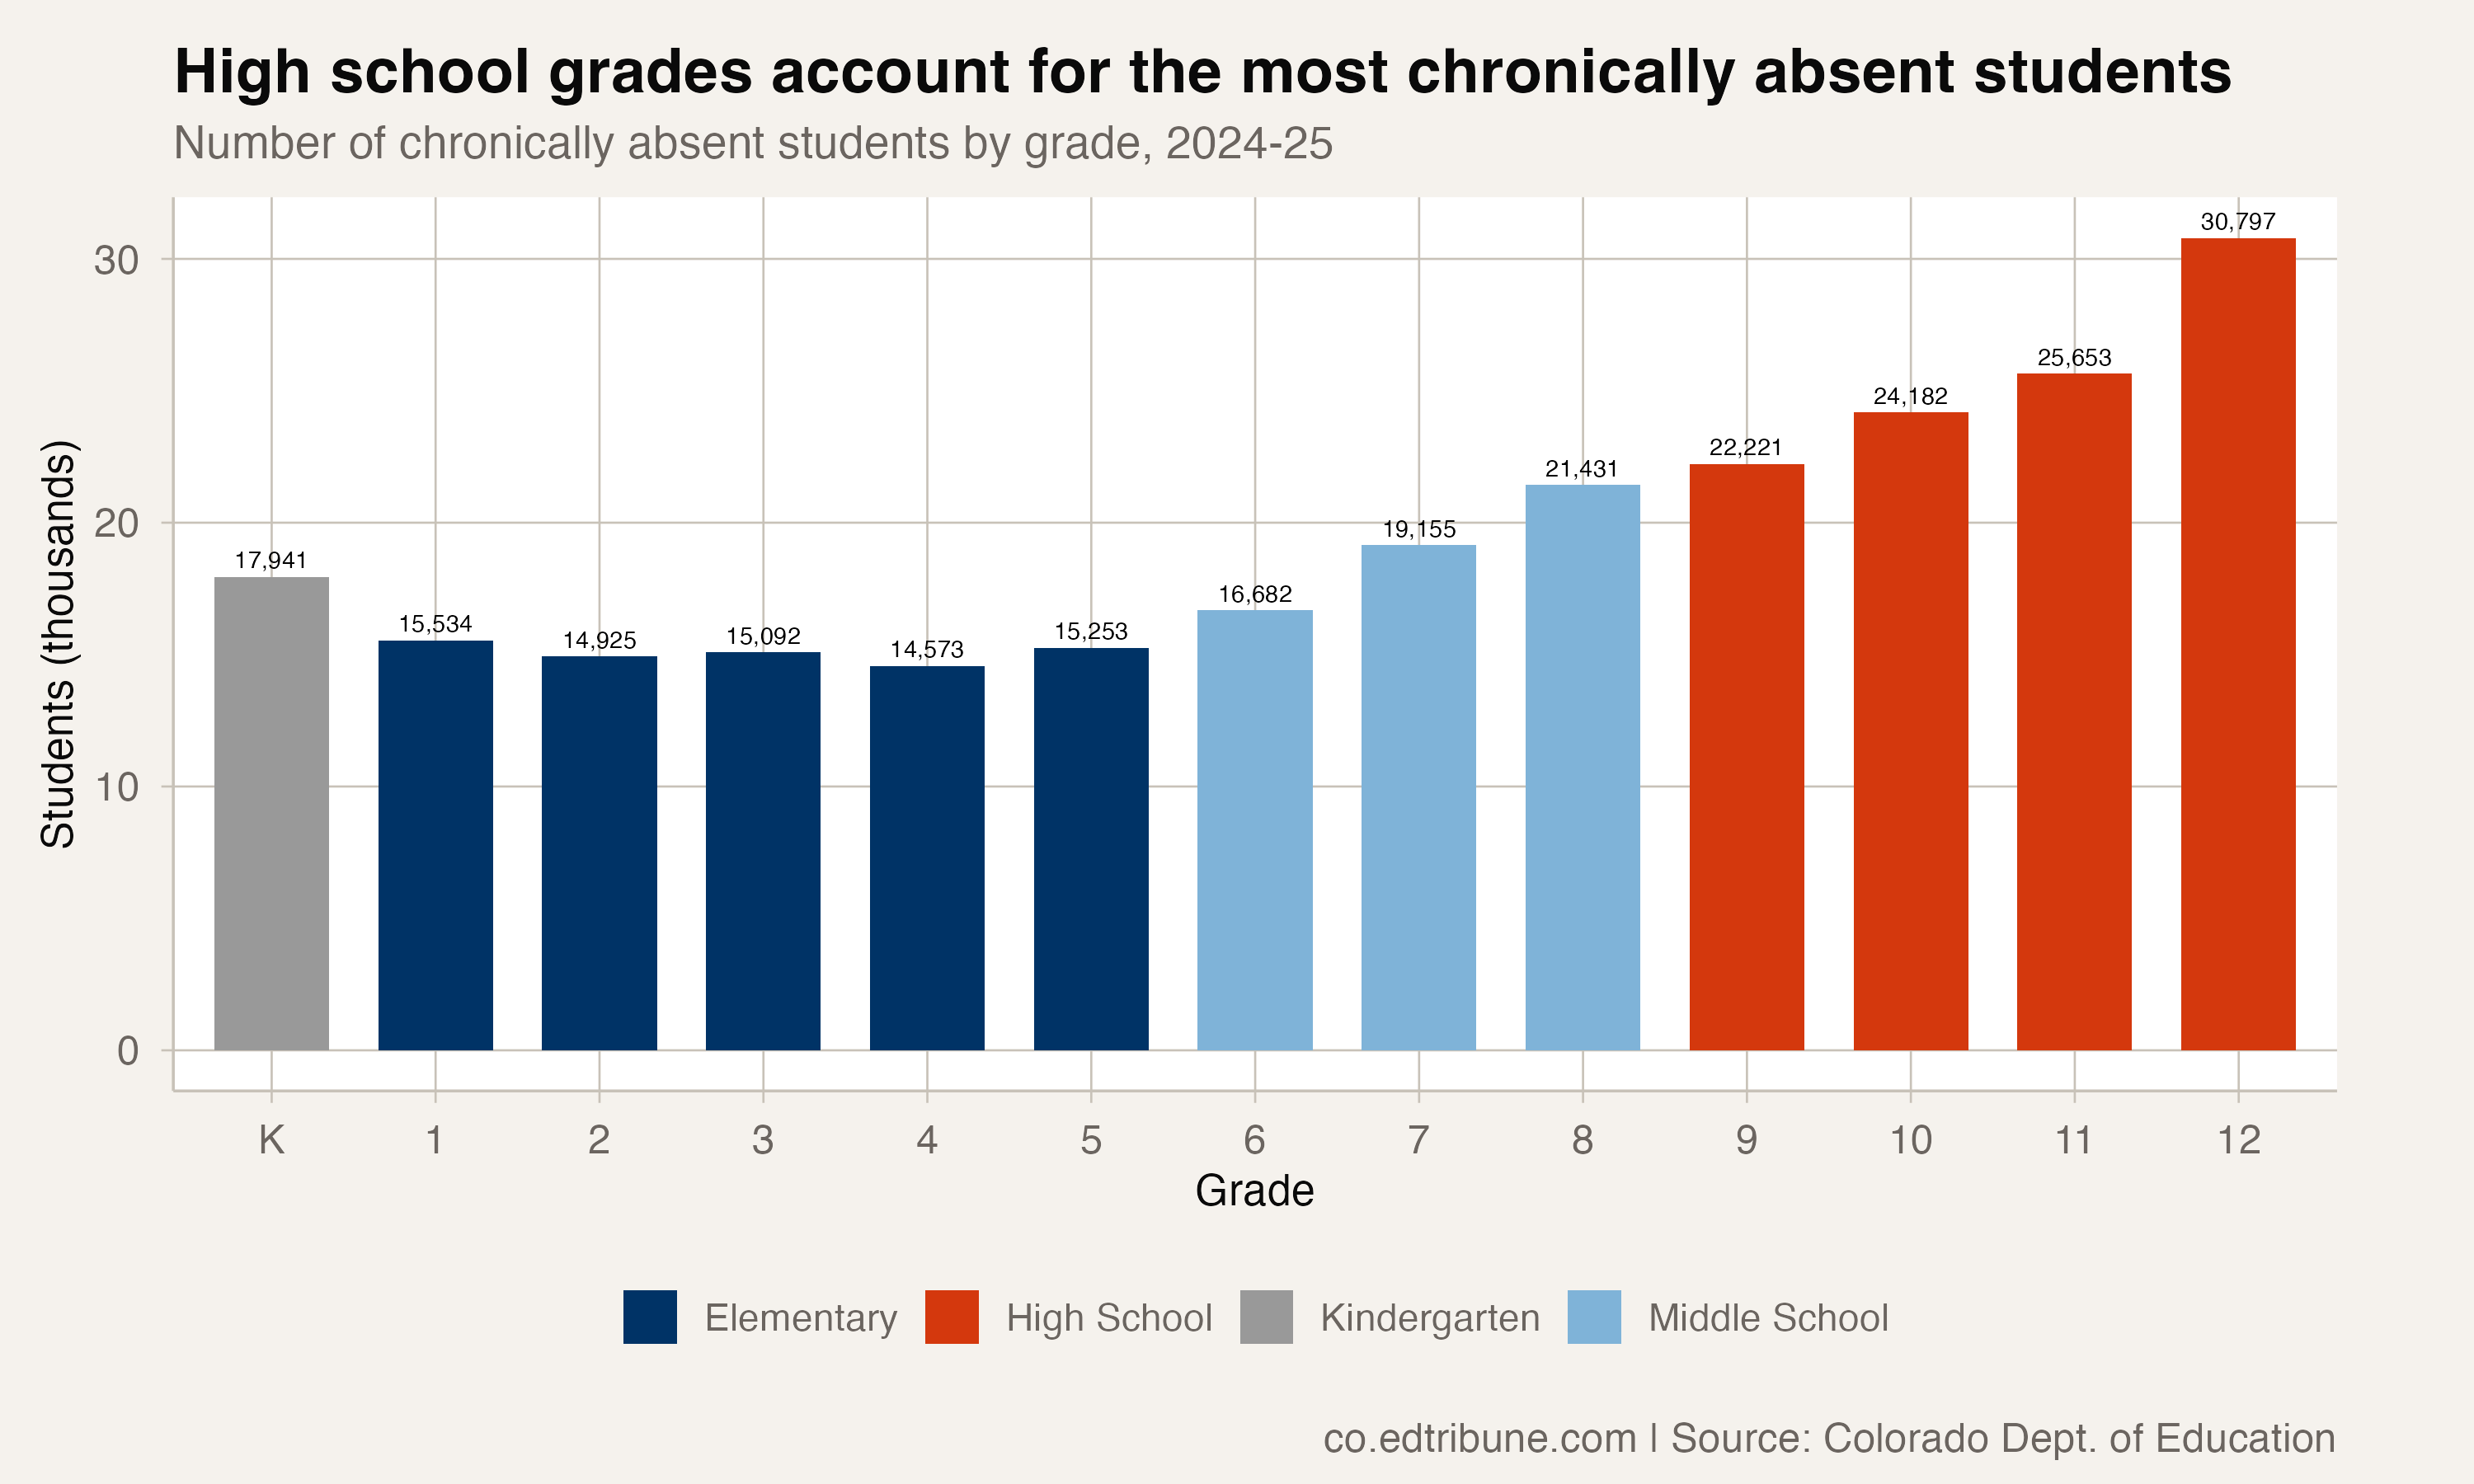
Rate alone understates the high school contribution. Twelfth grade had 30,797 chronically absent students, the most of any grade level and nearly double the kindergarten count of 17,941. The 12th grade cohort is also the largest by enrollment (74,763), which amplifies the impact of its 41.2% rate.
Together, the four high school grades accounted for 102,853 chronically absent students, compared to 75,377 across all five elementary grades (1-5) and 57,268 in the three middle school grades (6-8).
This concentration matters for policy. If Colorado's statewide rate is going to decline, high school rates must come down. The elementary improvements in 2024-25 were real but insufficient to offset the high school deterioration, both because high school rates are higher and because high school cohorts are larger.
The kindergarten anomaly
Kindergarten's 30.6% rate deserves separate attention. It sits above every elementary grade and most middle school grades, creating a U-shaped dip between kindergarten and the grade where rates begin their upward climb.
The likely explanation is cultural rather than structural. Many families do not yet treat kindergarten as a mandatory grade, even in states where it is. Medical appointments, family travel, and simple hesitancy about sending five-year-olds to school every day all suppress attendance. The 1.0 point improvement from 2023-24 suggests some progress on this front, but K remains an outlier.
The kindergarten question also has downstream implications. Students who establish irregular attendance patterns in K carry those patterns into 1st and 2nd grade. Whether the sharp drop from 30.6% in K to 25.9% in 1st grade represents a genuine behavioral change or a statistical artifact of selection (chronically absent kindergartners are more likely to not enroll in 1st grade) is not clear from this data alone.
Detailed code that reproduces the analysis and figures in this article is available exclusively to EdTribune subscribers.
Discussion
Sign in to join the discussion.
Loading comments...