Chronic absenteeism among Denver's↗ET Limited English Proficient students jumped from 41.1% to 44.2% in 2024-25, a 3.1 percentage point increase affecting 13,601 students. It was the sharpest worsening of any Denver subgroup except students who are currently homeless, and it occurred during a year when Denver Public Schools explicitly cited federal immigration enforcement as a contributing factor.
"Presidential Executive Orders and ICE activity in the community in the spring" created fear among immigrant families, the district told the Denver Post. The data cannot isolate immigration enforcement as the sole cause of the LEP increase, but the timing, magnitude, and pattern across related subgroups all point in the same direction.
The subgroup pattern
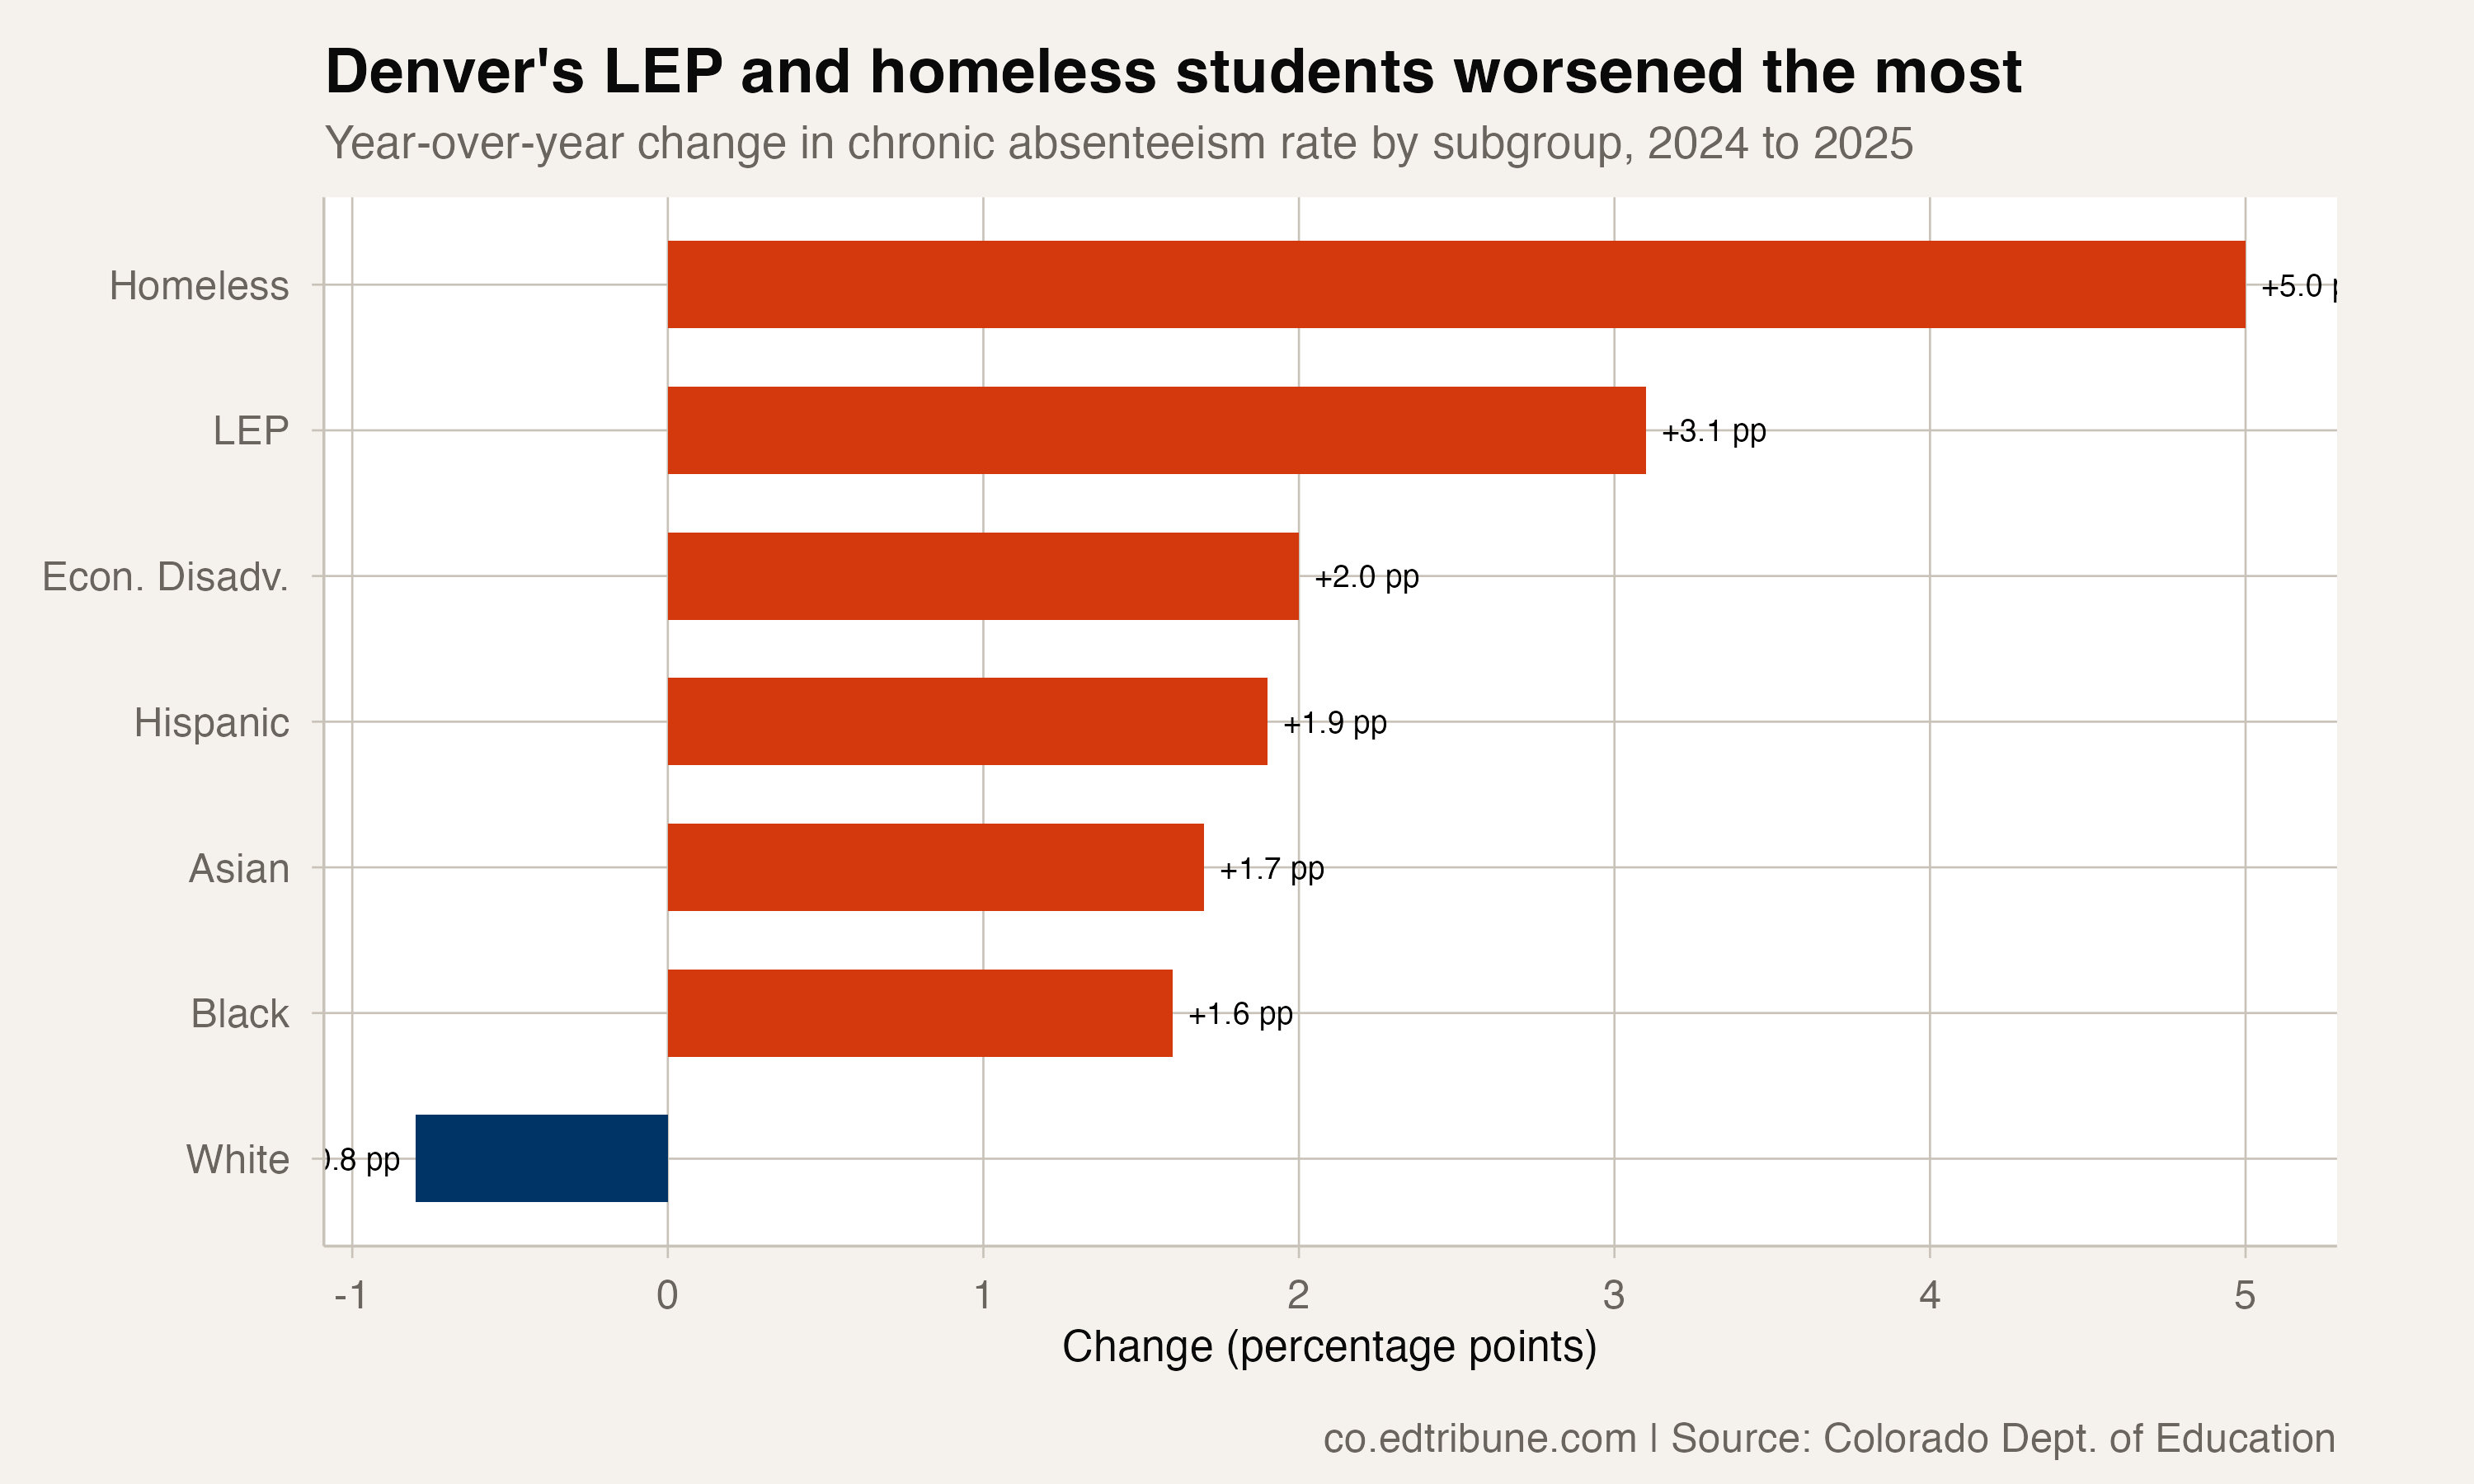
Denver's subgroup data tells a clear story about which populations absorbed the 2024-25 worsening. Students who are currently homeless led with a 5.0 point increase to 76.2%. LEP students followed at 3.1 points. Economically disadvantaged students rose 2.0 points to 47.4%. Hispanic students climbed 1.9 points to 47.2%.
White students were the only group to improve, dropping 0.8 points to 17.5%. The pattern is stark: Denver's most vulnerable populations worsened while its most affluent improved, widening equity gaps across the board.
LEP and Hispanic: overlapping crises
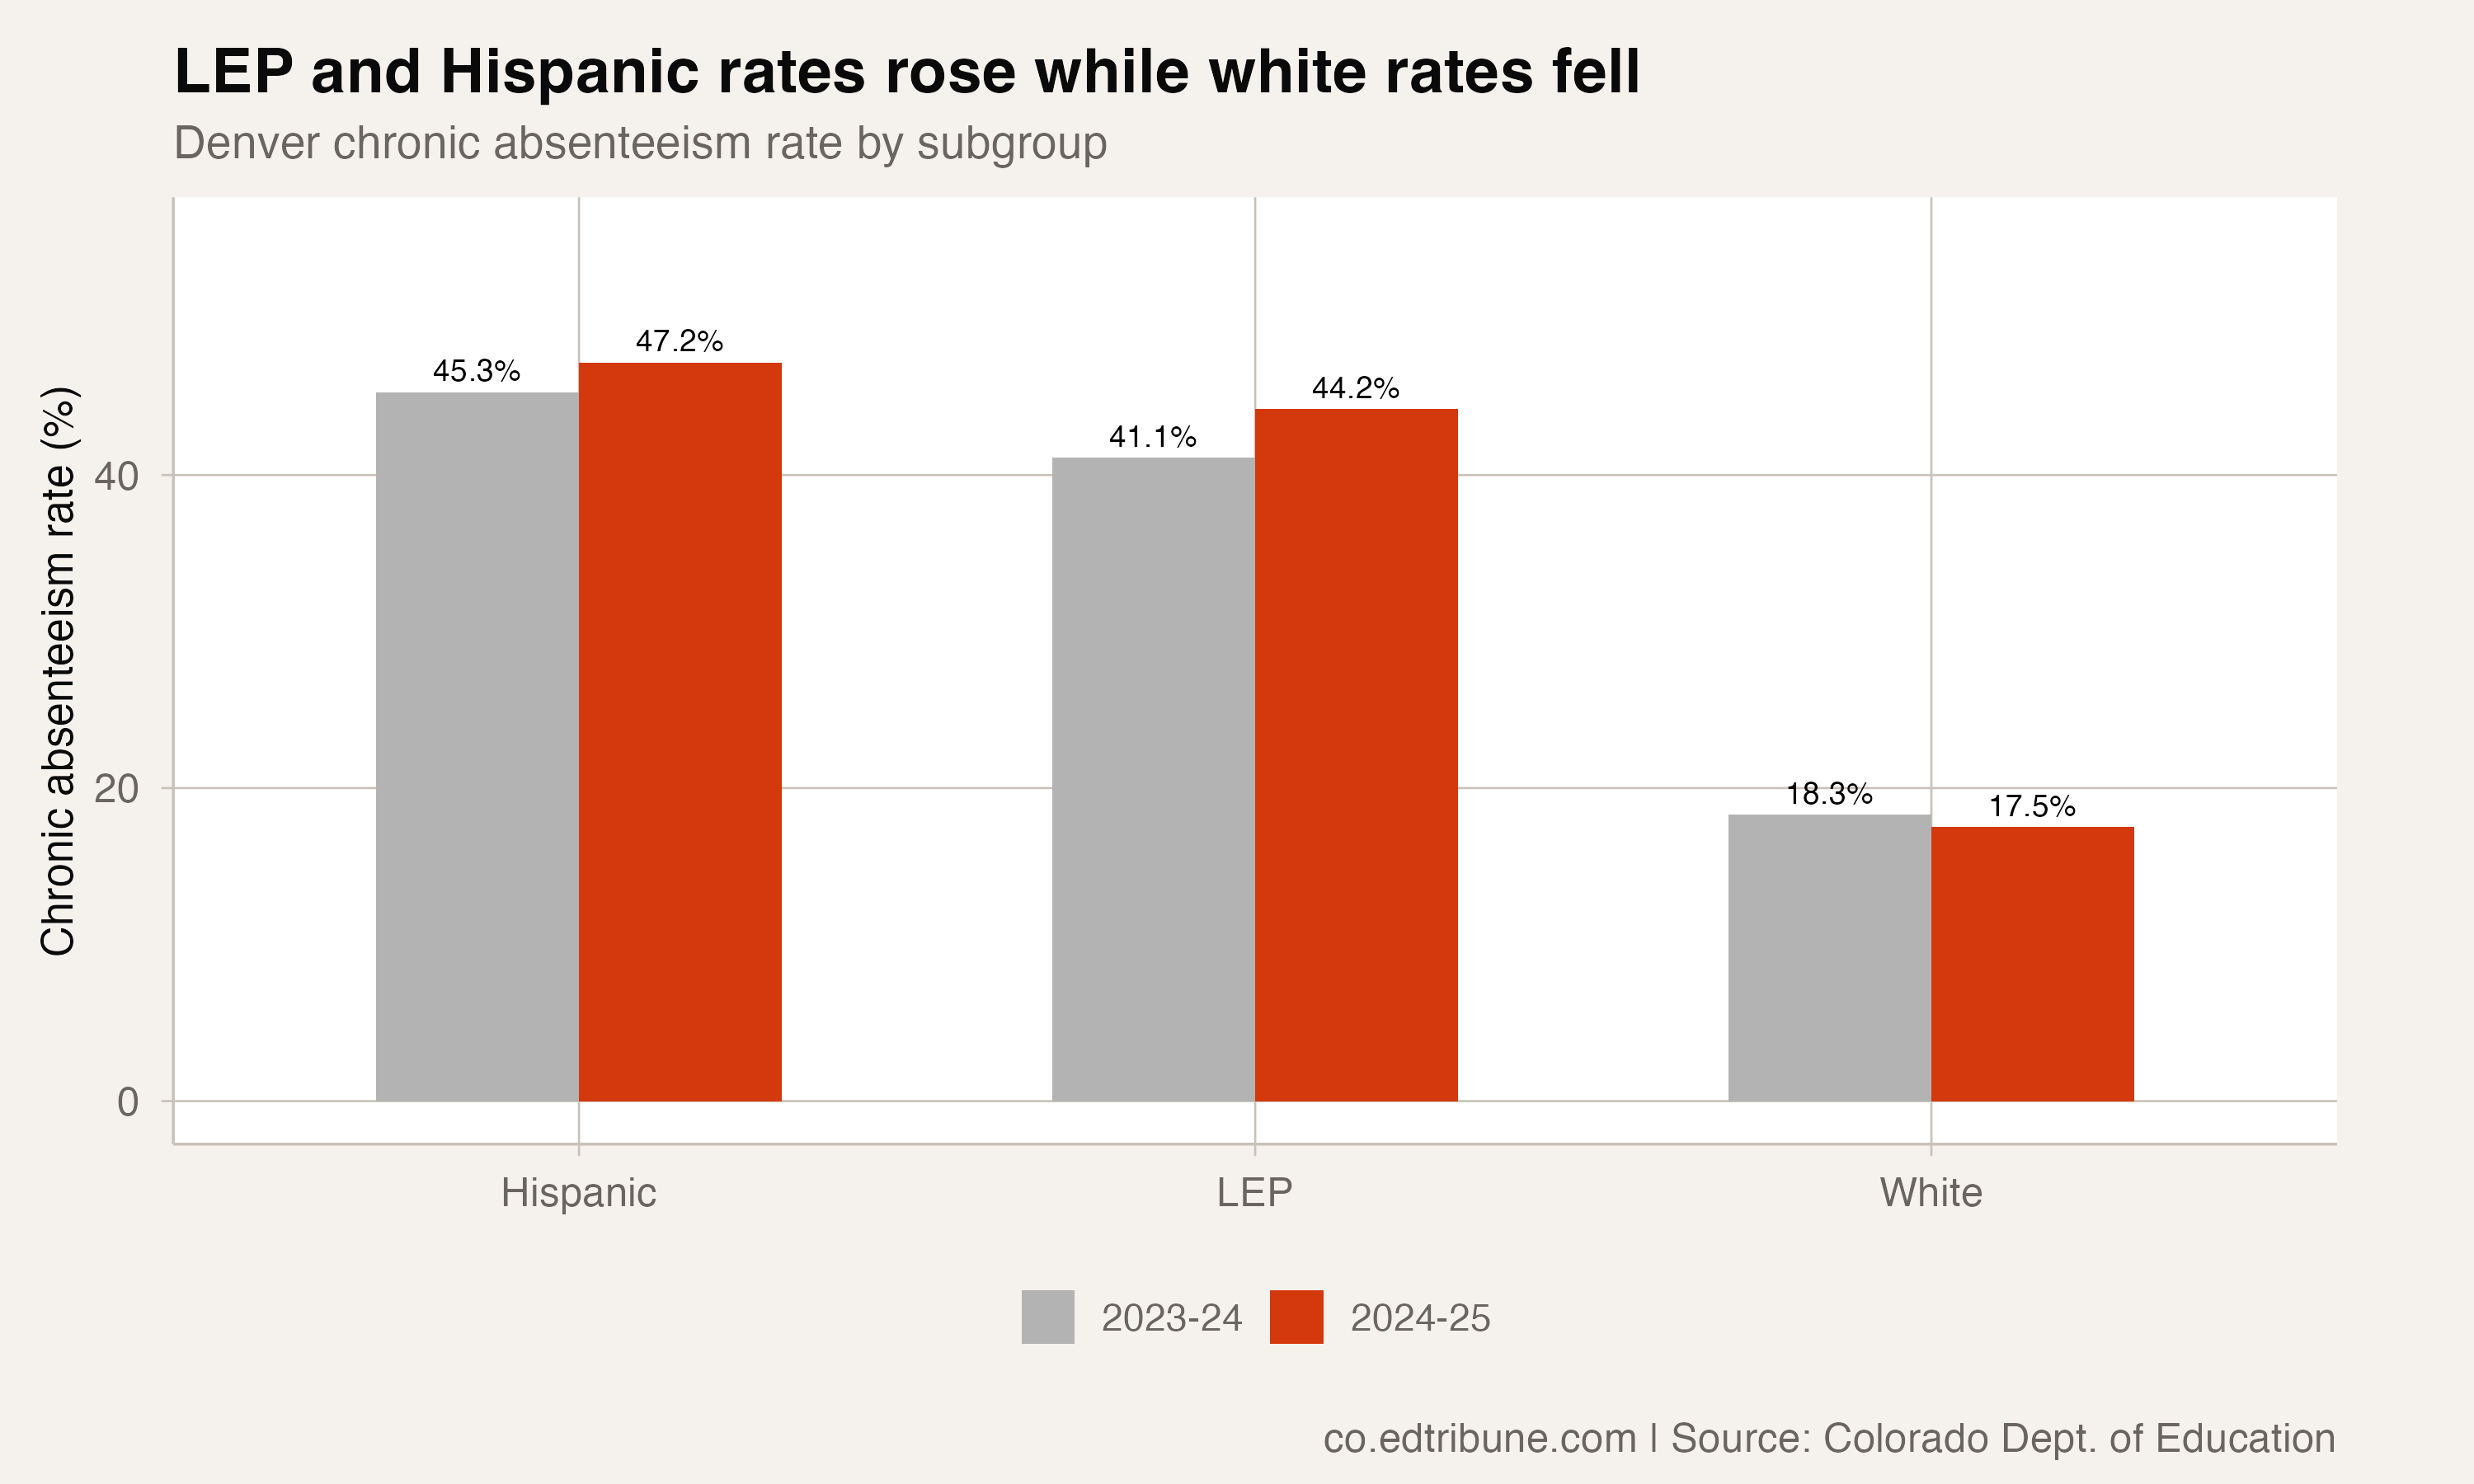
The LEP and Hispanic populations in Denver overlap significantly. Many LEP students are Hispanic, and many Hispanic students come from families where immigration status is a concern. The parallel worsening of both groups, LEP up 3.1 points and Hispanic up 1.9 points, suggests a shared driver.
Nearly half of Denver's Hispanic students, 47.2%, are now chronically absent. For LEP students, 44.2%. These are not marginal populations within Denver. Hispanic students represent the district's largest demographic group, and LEP students number in the thousands. When nearly half of either group misses significant school time, it is not an outlier story. It is the central fact about attendance in Colorado's capital city.
A statewide LEP problem
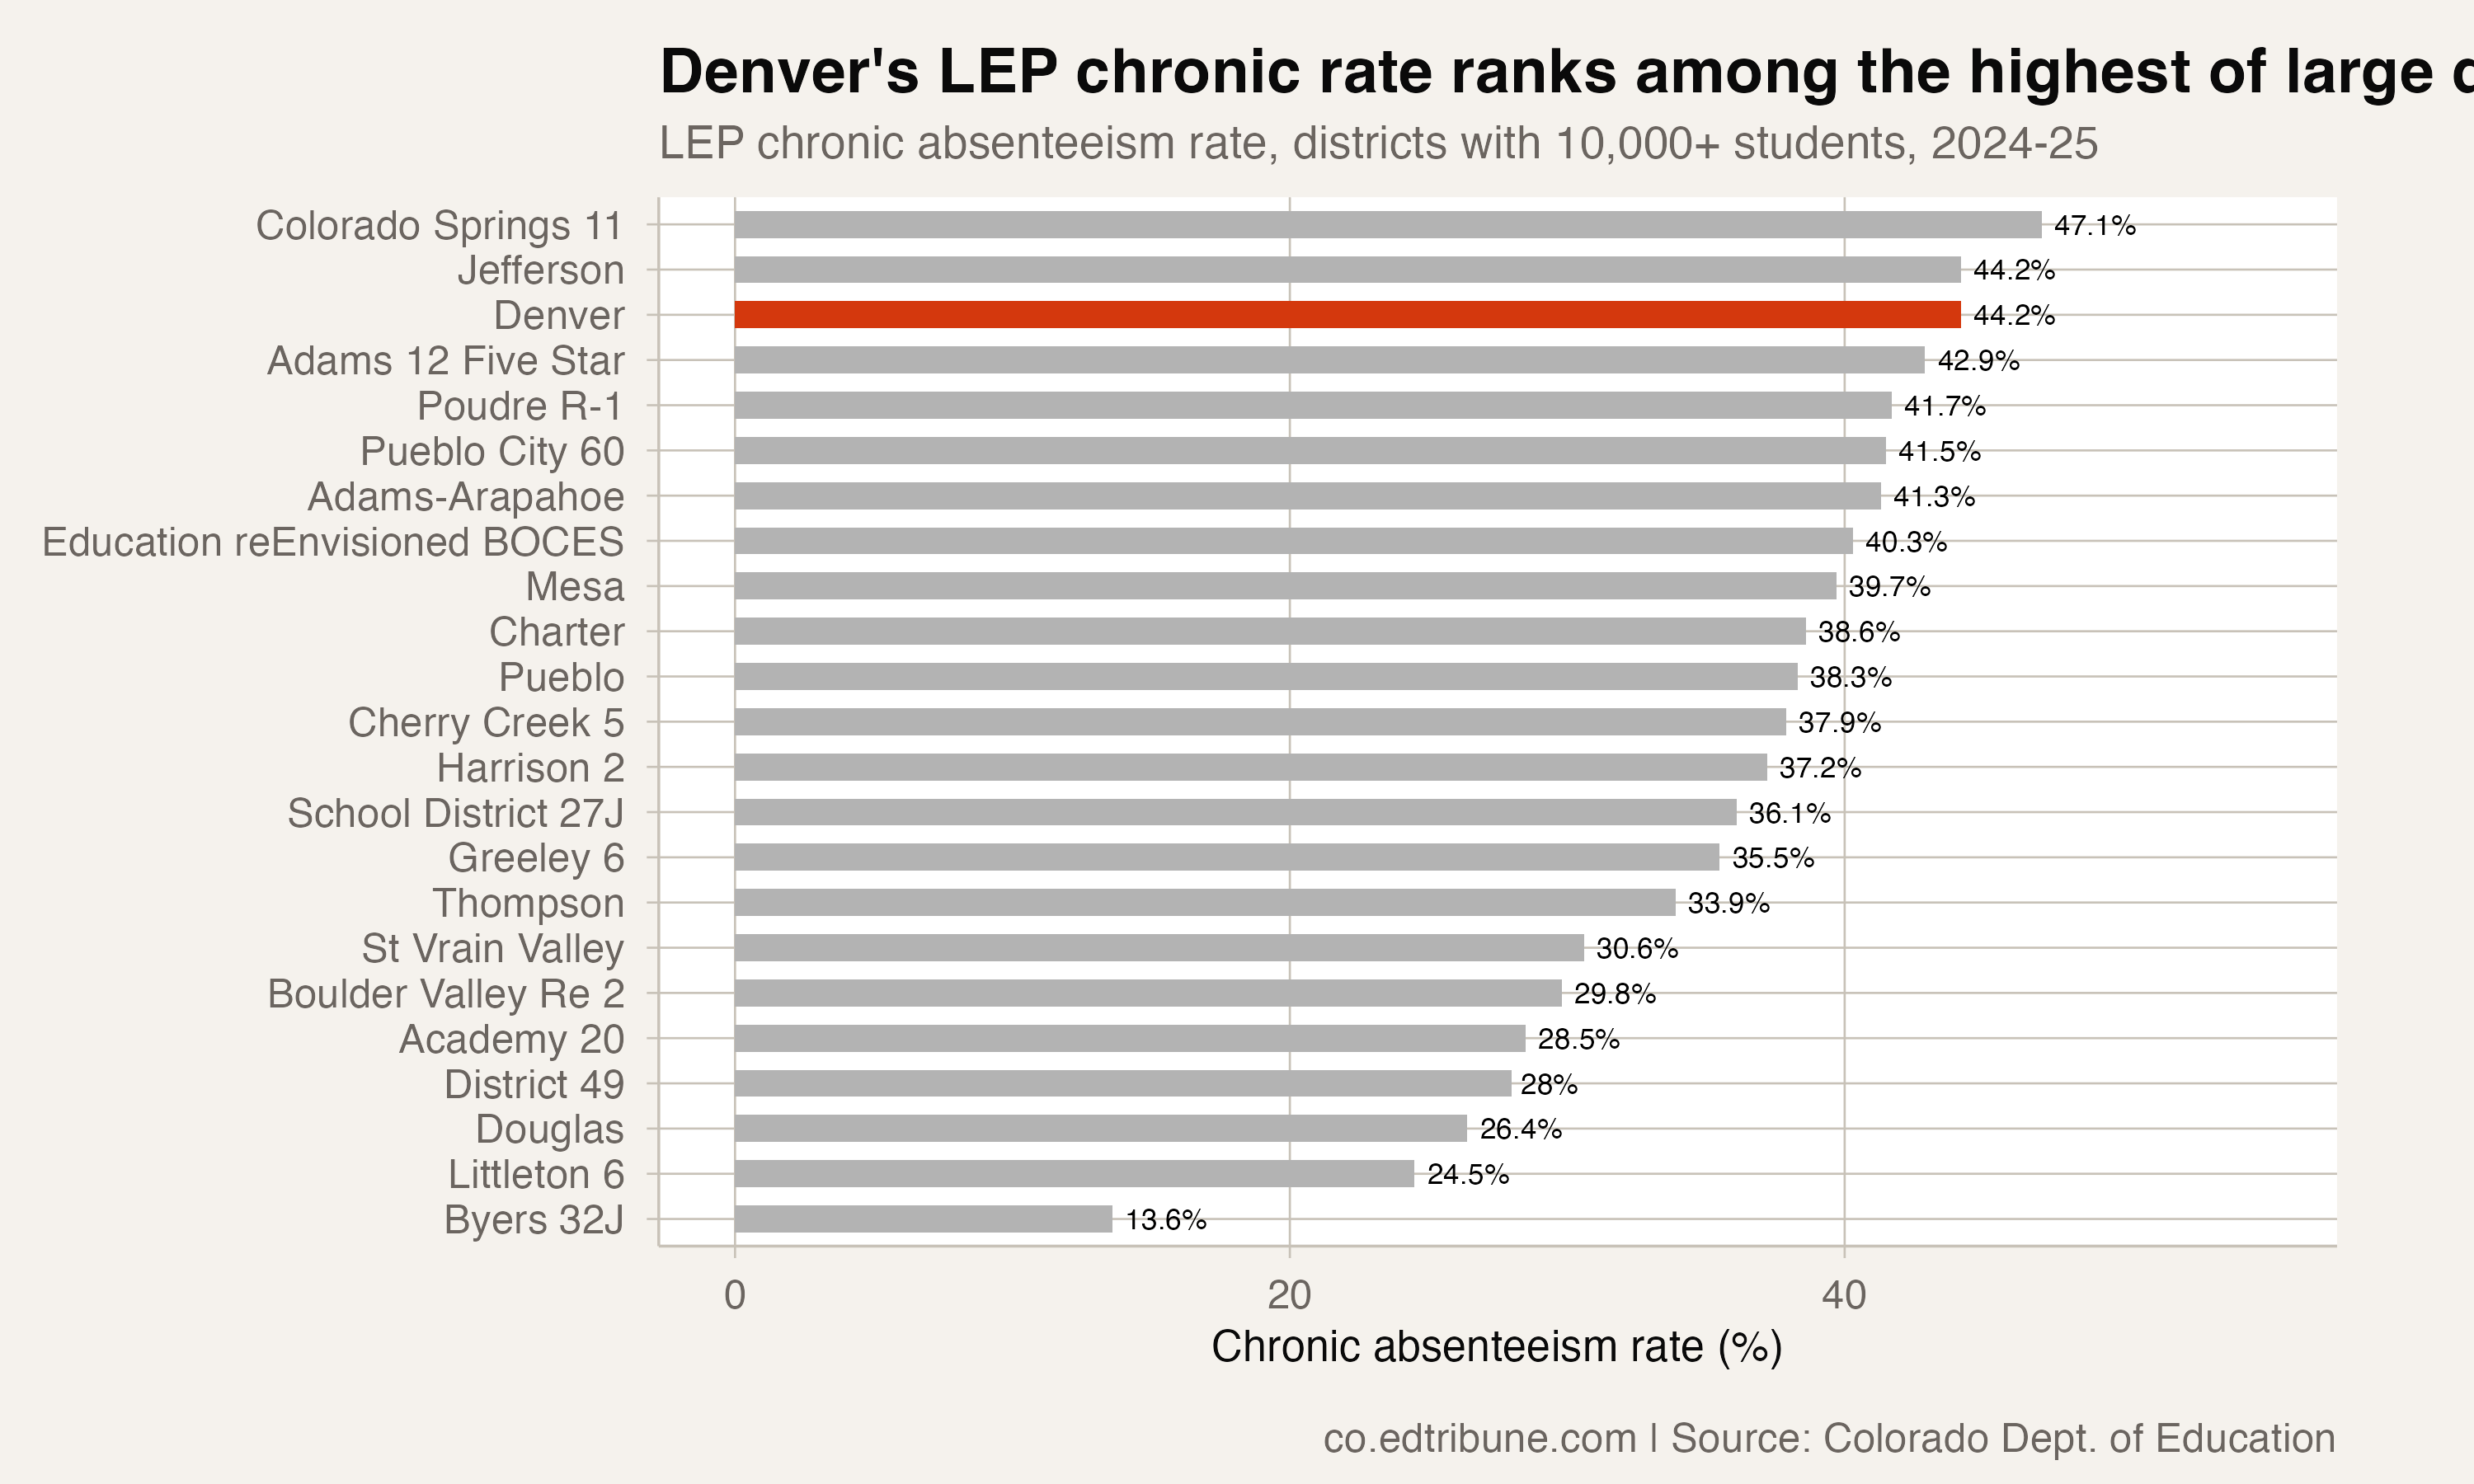
Denver's LEP increase was substantial, but it was not the largest. Colorado Springs D11↗ET saw its LEP chronic absenteeism rate jump by 17.4 percentage points, from 29.7% to 47.1%, part of the district's across-the-board collapse. Jefferson County↗ET rose 4.4 points. Eagle County climbed 5.1 points.
Statewide, 24 of 34 large districts with LEP data saw their LEP chronic absenteeism rates increase in 2024-25. The breadth suggests that whatever is driving LEP absenteeism, whether immigration enforcement, language barriers, economic pressures, or some combination, is not unique to Denver.
The few districts where LEP chronic rates improved tend to be smaller and more rural. Poudre R-1 dropped 2.1 points. Montrose County fell 2.1 points. District 49 improved 2.7 points. These improvements, while encouraging, involve far fewer students than the large-district increases.
Denver named the cause. Most districts won't.
Denver's attribution of part of its worsening to ICE activity is notable because districts rarely name specific federal policy as a factor in their attendance data. The willingness to do so suggests the effect was visible enough at the school level to be unmistakable, even if the data alone would show only the aggregate result.
The mechanisms are well-documented in immigrant communities across the country: families keeping children home on days when enforcement activity is reported, parents detained or deported leaving children without transportation, families relocating across district lines before formal withdrawal. Denver's 3.1 point LEP increase and 1.9 point Hispanic increase are consistent with all of these.
LEP students who miss significant instruction face compounding disadvantages: they are simultaneously learning English and losing instructional time, falling behind peers in both language acquisition and content knowledge. For 13,601 Denver students, chronic absence is not just delay. It may permanently narrow the path.
Detailed code that reproduces the analysis and figures in this article is available exclusively to EdTribune subscribers.
Discussion
Sign in to join the discussion.
Loading comments...