Denver↗ET and Aurora↗ET sit side by side on the Front Range, Colorado's two largest high-poverty urban districts. Both surged past 43% chronic absenteeism during the pandemic. Both appeared to be recovering. Then their paths split.
In 2024-25, Aurora improved for the third consecutive year, dropping from 40.1% to 38.9%. Denver reversed, climbing from 37.1% to 38.1%. The two districts, separated by less than a percentage point, are now heading in opposite directions.
Converging from different places
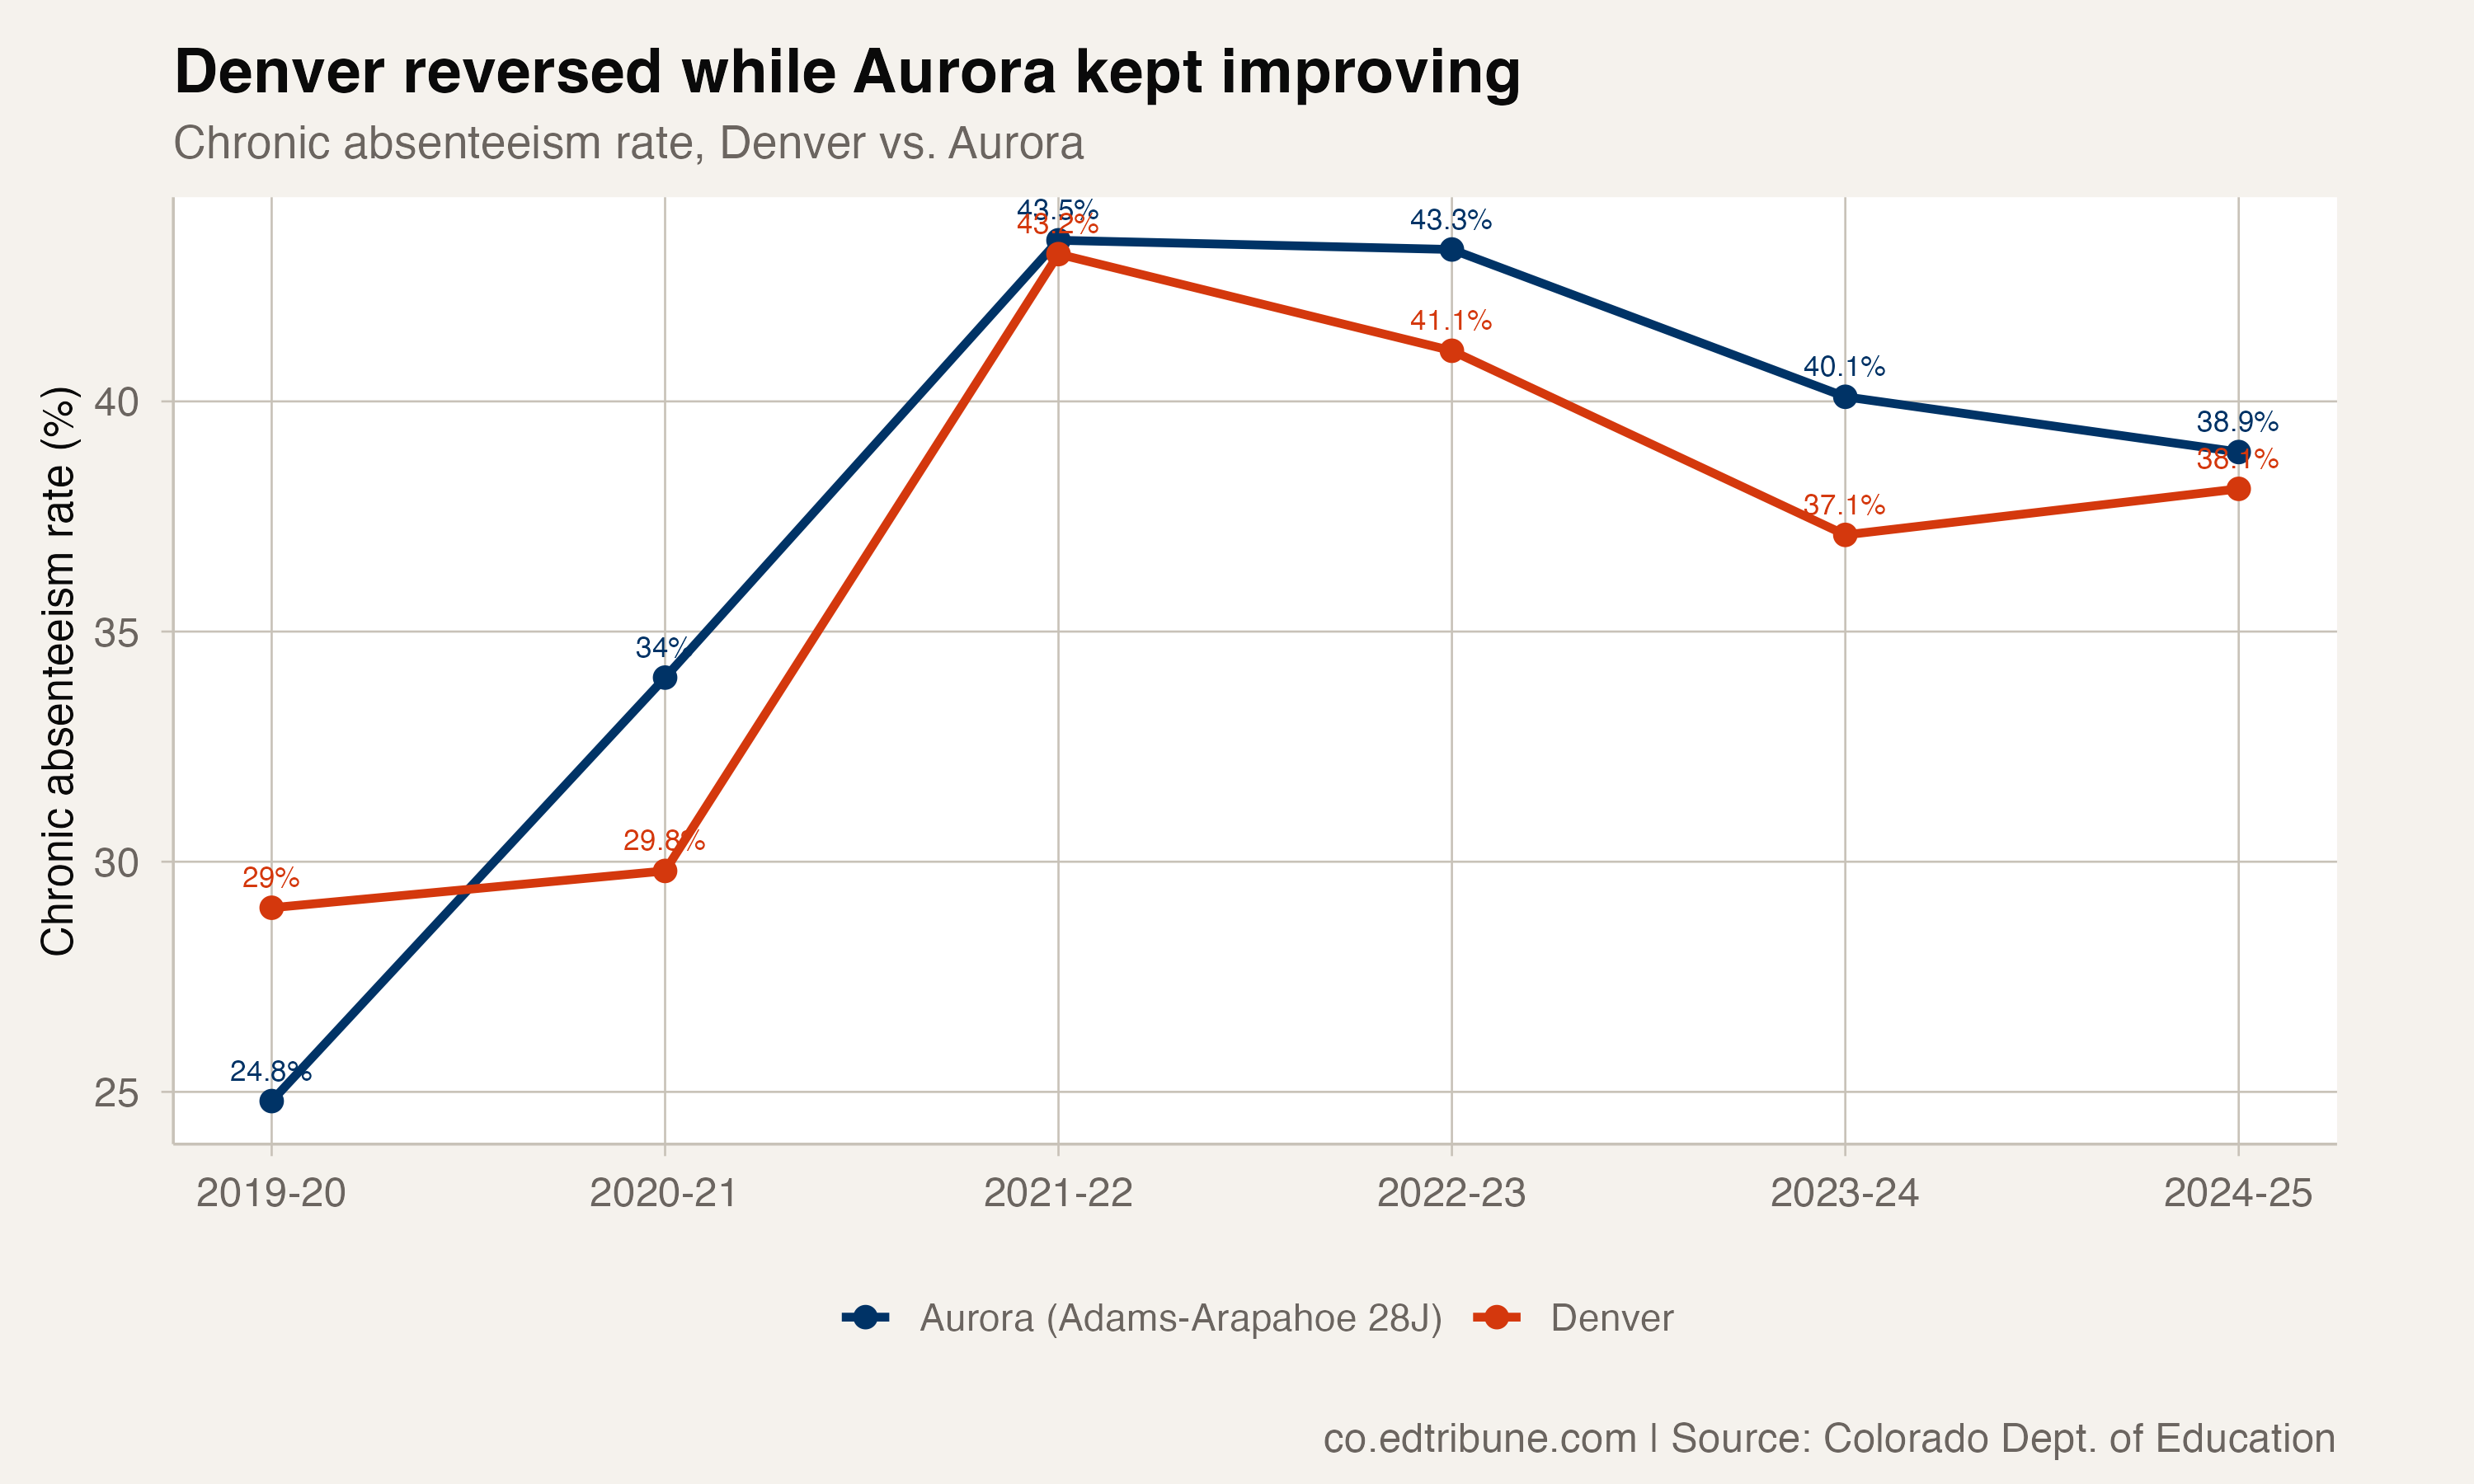
The six-year trend reveals how different these two districts' journeys have been. In 2019-20, Denver was worse: 29.0% chronic absence compared to Aurora's 24.8%. Both surged during COVID, but Aurora's increase was more extreme. By 2021-22, Aurora had reached 43.5% while Denver hit 43.2%.
Aurora then stalled in 2022-23, barely moving (43.3%), before beginning a steady descent: 40.1% in 2023-24, then 38.9% in 2024-25. Three consecutive years of improvement.
Denver's early recovery was actually faster. The district dropped 2.1 points in 2022-23 and then 4.0 points in 2023-24, its best single-year improvement in the dataset. But 2024-25 brought a 1.0 point reversal, adding roughly 857 chronically absent students.
The gap collapses
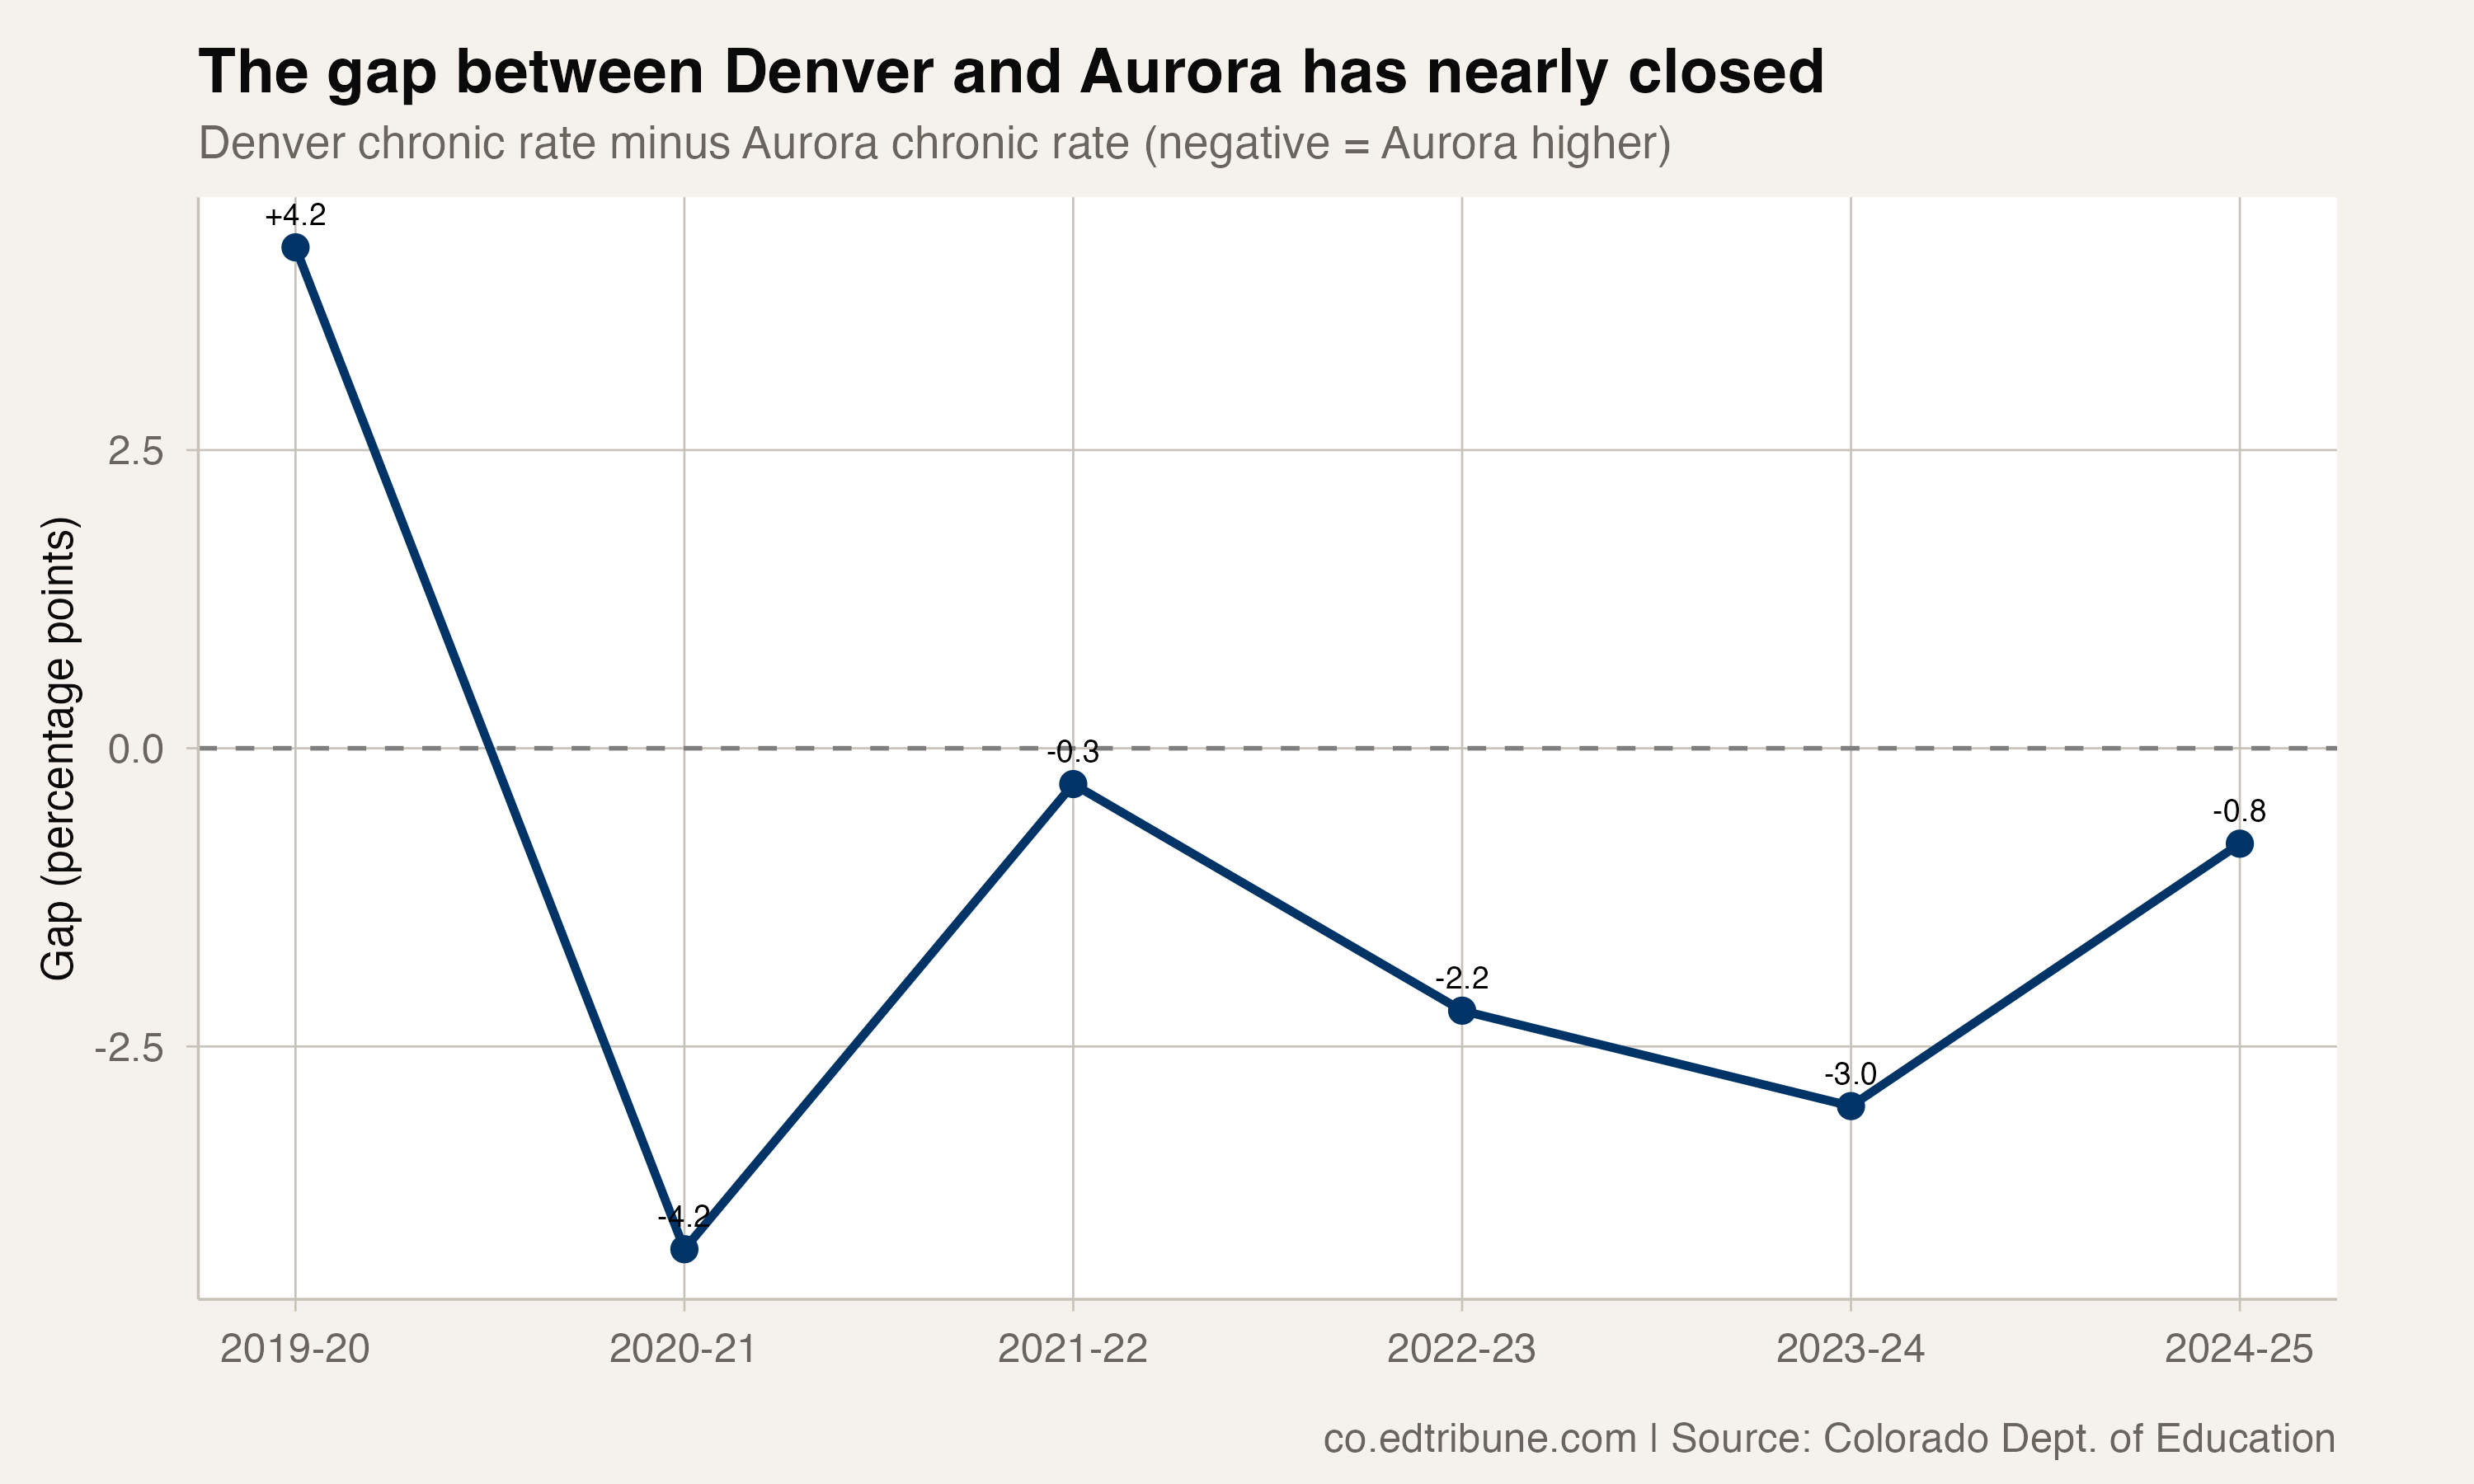
Before the pandemic, Denver's chronic rate exceeded Aurora's by 4.2 percentage points. That gap narrowed during COVID as Aurora surged more dramatically. By 2021-22, Aurora was actually 0.3 points worse than Denver.
Now the gap has nearly vanished. Denver sits at 38.1%, Aurora at 38.9%. If current trajectories continue, Denver may soon overtake Aurora, a reversal that was hard to imagine a few years ago when Aurora's post-pandemic stall looked permanent.
Different patterns within
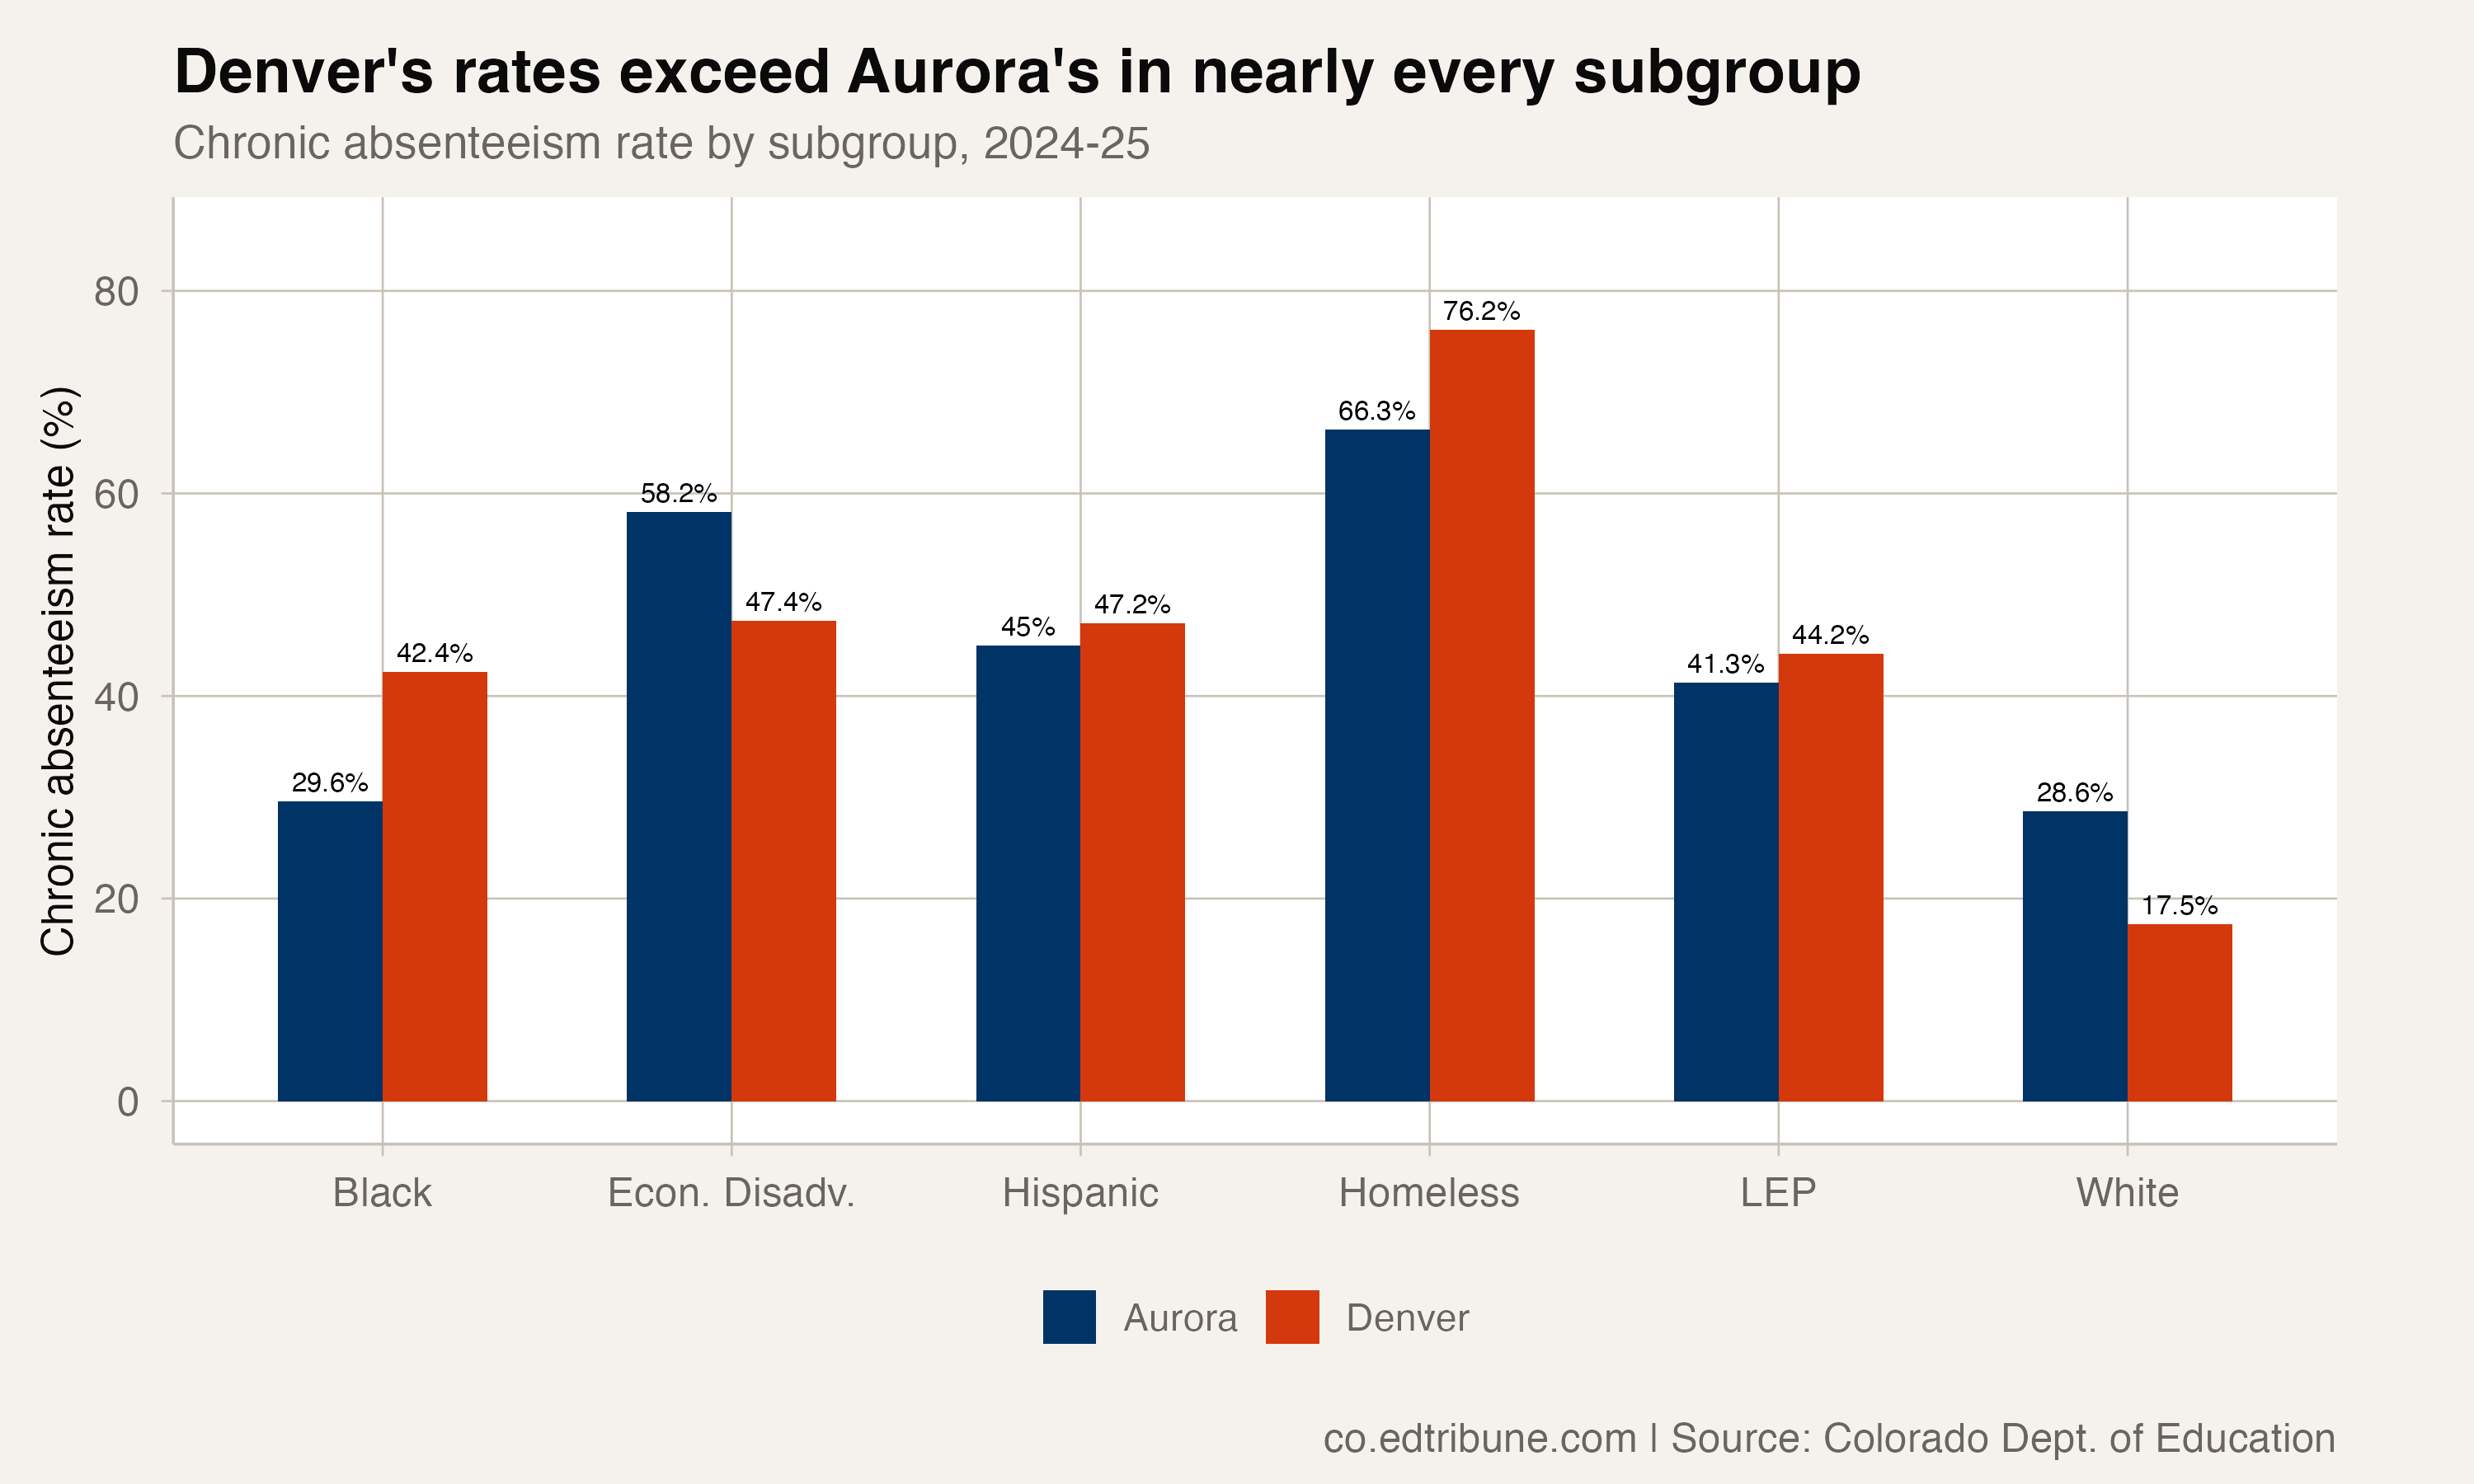
The aggregate rates mask very different internal patterns. Denver's white students have a 17.5% chronic rate, far lower than Aurora's 28.6%. But Denver's Black students face a 42.4% rate compared to Aurora's 29.6%, a gap of nearly 13 points.
Denver's students who are currently homeless are chronically absent at 76.2%, 10 points higher than Aurora's 66.3%. On the other hand, Aurora's economically disadvantaged rate of 58.2% exceeds Denver's 47.4%, perhaps reflecting different Community Eligibility Provision (CEP) participation rates that make the populations not perfectly comparable.
The subgroup data suggests that Denver's overall worsening is driven heavily by its most vulnerable populations: students who are currently homeless (+5.0pp from 2023-24), LEP students (+3.1pp), and Hispanic students (+1.9pp). Denver Public Schools itself has attributed part of the LEP and Hispanic worsening to immigration enforcement activity that created fear among immigrant families during the spring of 2025.
Aurora, despite serving a similarly diverse and high-poverty population, managed broad-based improvement. Whether Aurora's improvement reflects different policy choices, different community dynamics, or different exposure to the factors driving Denver's reversal is a question the data alone cannot answer.
What divergence reveals
The Denver-Aurora divergence matters because it undermines the narrative that chronic absenteeism is driven primarily by factors outside a district's control. These two districts share a metropolitan area, serve similar demographics, and face similar housing costs and labor markets. If the problem were purely structural, determined by poverty rates and housing instability, their trajectories would not diverge this sharply.
Something about how these districts operate -- how they communicate with families, how they respond to early warning signs, how they adapt to community disruption -- appears to produce different outcomes. Aurora's three-year improvement streak did not happen by accident. Neither did Denver's reversal.
Detailed code that reproduces the analysis and figures in this article is available exclusively to EdTribune subscribers.
Discussion
Sign in to join the discussion.
Loading comments...