Correction: This article has been revised to use original annual enrollment totals, define the complete-history comparison, and preserve verified district context without treating externally supplied figures as state enrollment counts. Unsupported explanations and forecasts have been removed.
Weld RE-4↗ET reported 8,883 students in 2025–2026, last school year and the most recent published data. Its enrollment increased in all 11 consecutive annual comparisons within the checked history, beginning with 2014–2015.
The district started that history with 5,102 students. Its gain of 3,781 was a 74.1% increase. Over the same interval, Colorado’s separately published statewide enrollment fell from 889,006 to 870,793, a decline of 18,213 students, or 2.0%.
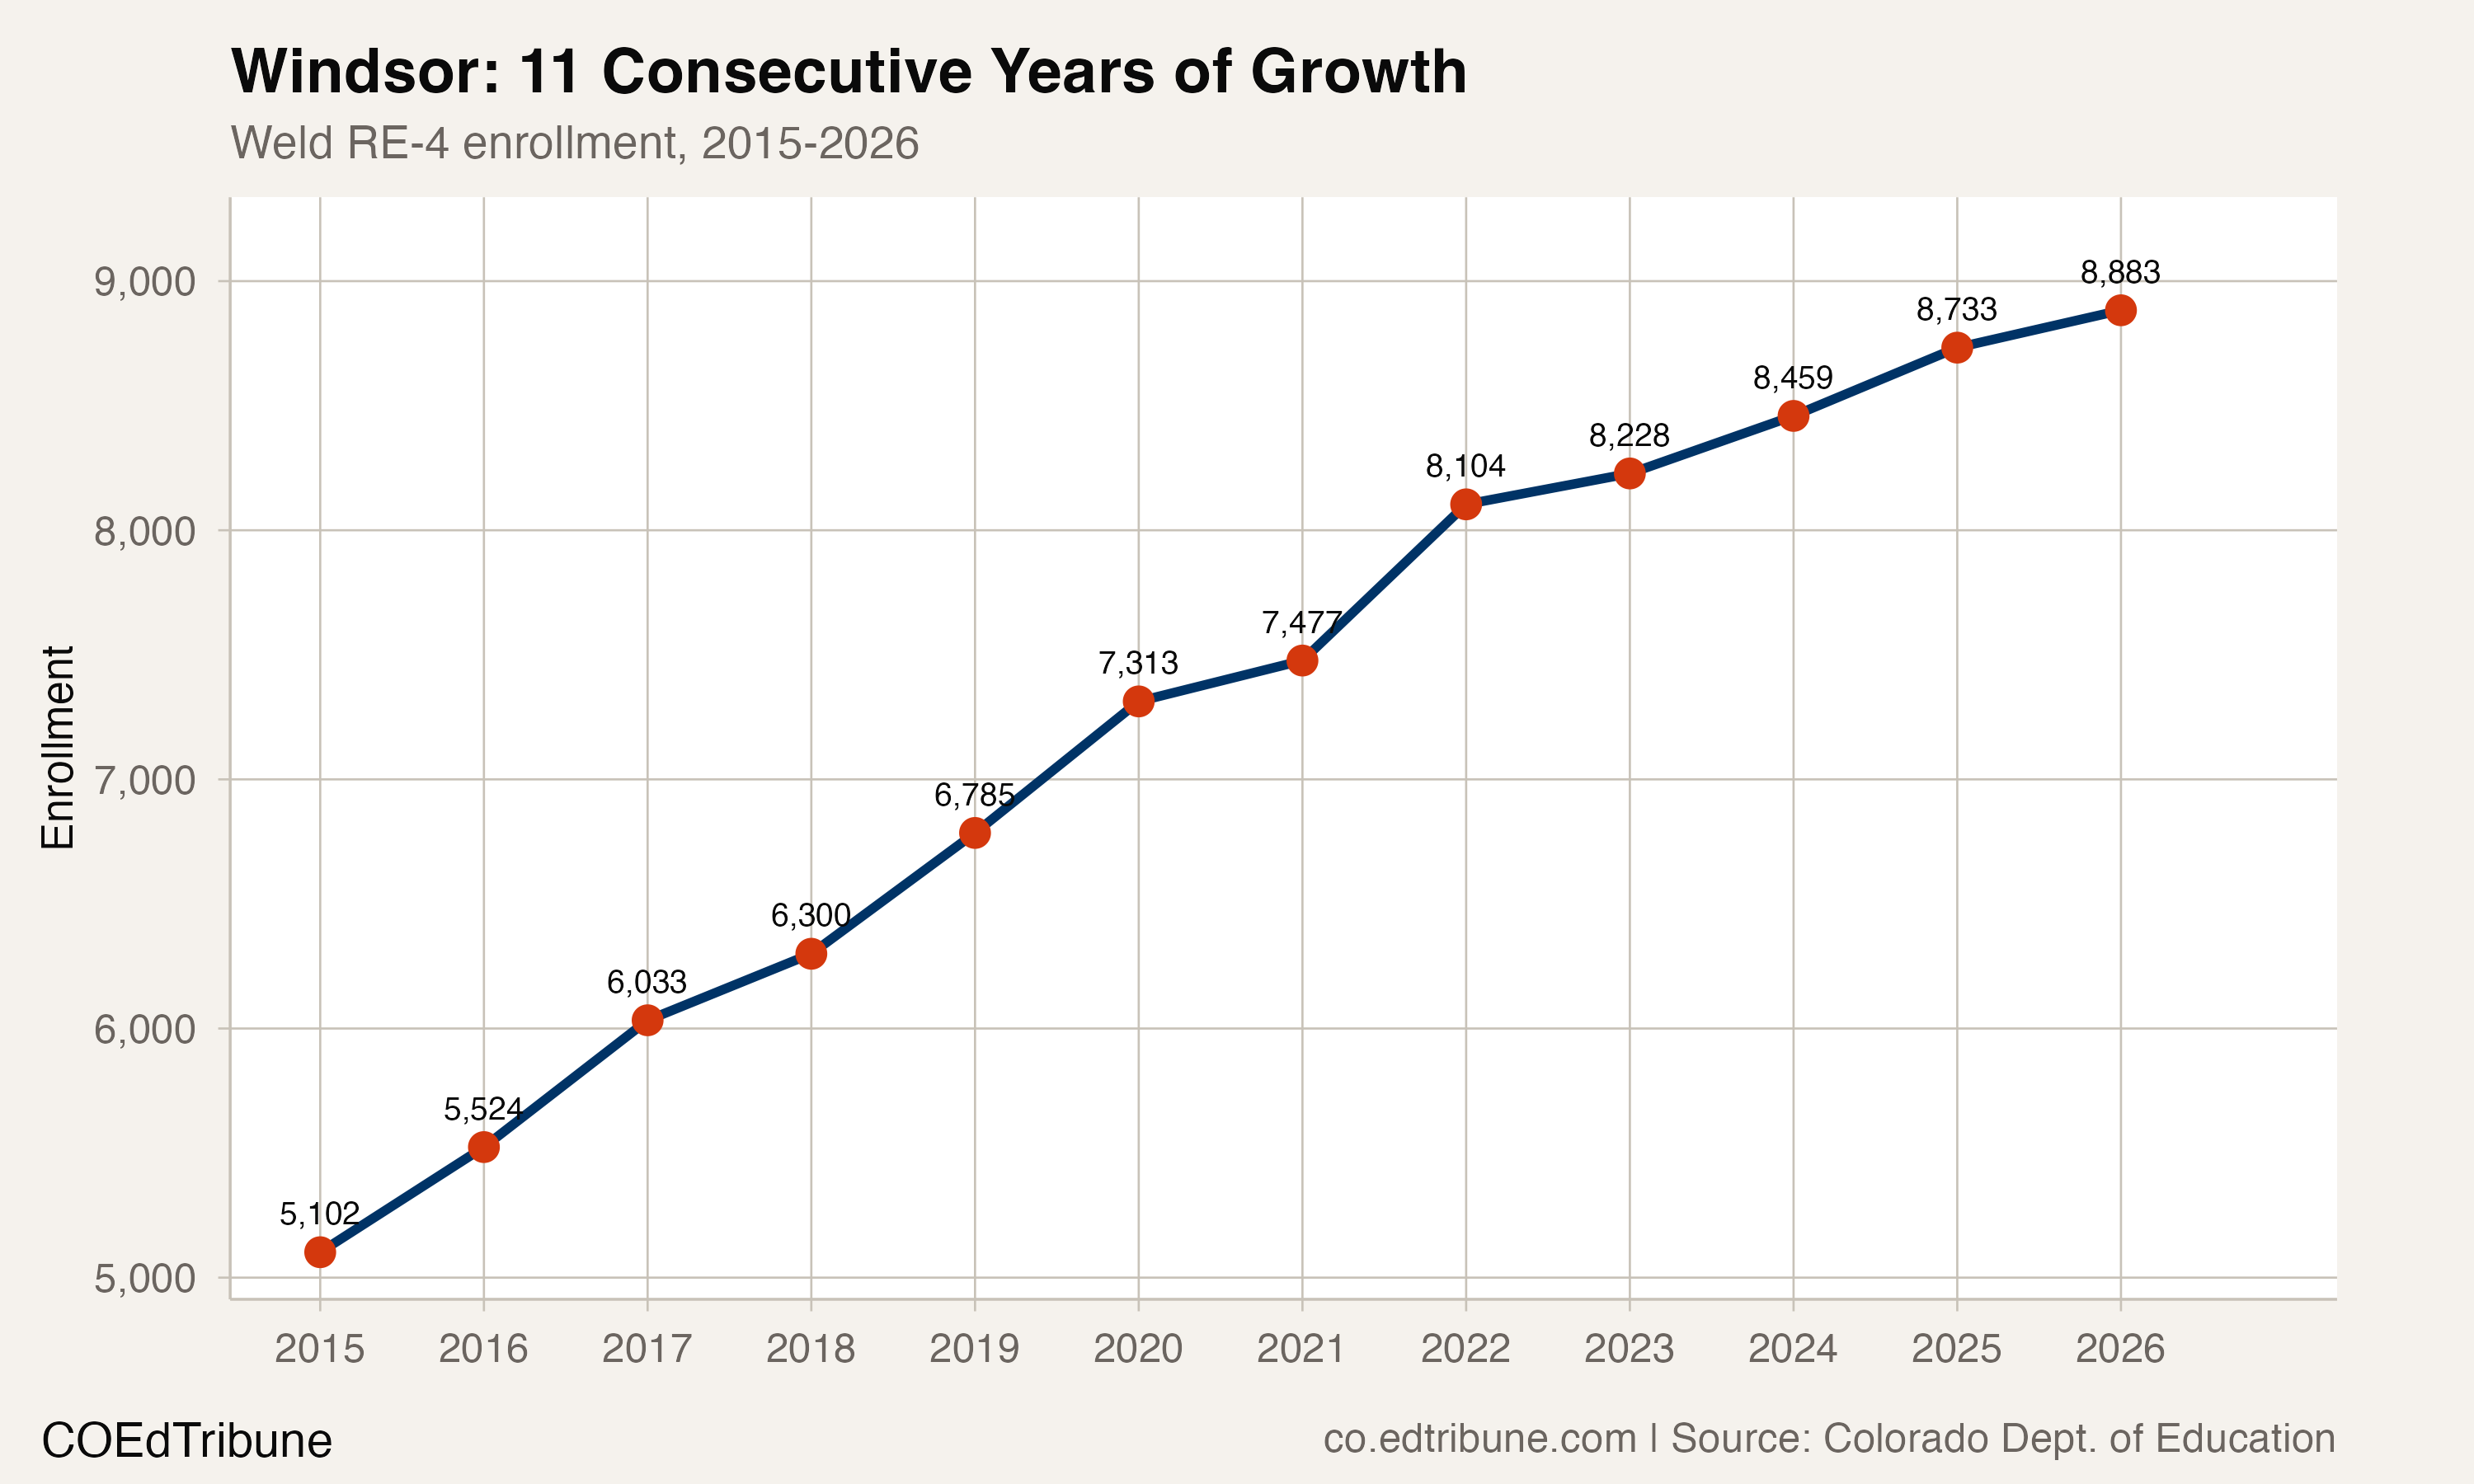
An unbroken sequence within the checked history
Weld RE-4 was the only reporting organization with an increase in every adjacent annual comparison among the 185 organizations with complete, unchanged identifiers across the full reporting window. Organizations with incomplete histories were excluded from that test rather than joined to another identifier or filled with assumed counts.
The comparison includes different kinds of reporting organization, not exclusively geographic school districts. The result is bounded by the original annual files checked. It does not establish an uninterrupted growth history before that period or predict another increase after it.
The district added students even during the first pandemic-era comparison. While the statewide count fell by 30,024 between 2019–2020 and 2020–2021, Weld RE-4 added 164 students. Its most recent annual gain was 150.
Growth persisted, but the annual additions varied
The largest addition within the sequence was 627 students in 2021–2022. The smallest was 124 in 2022–2023. The most recent addition was the second-smallest in the checked sequence.
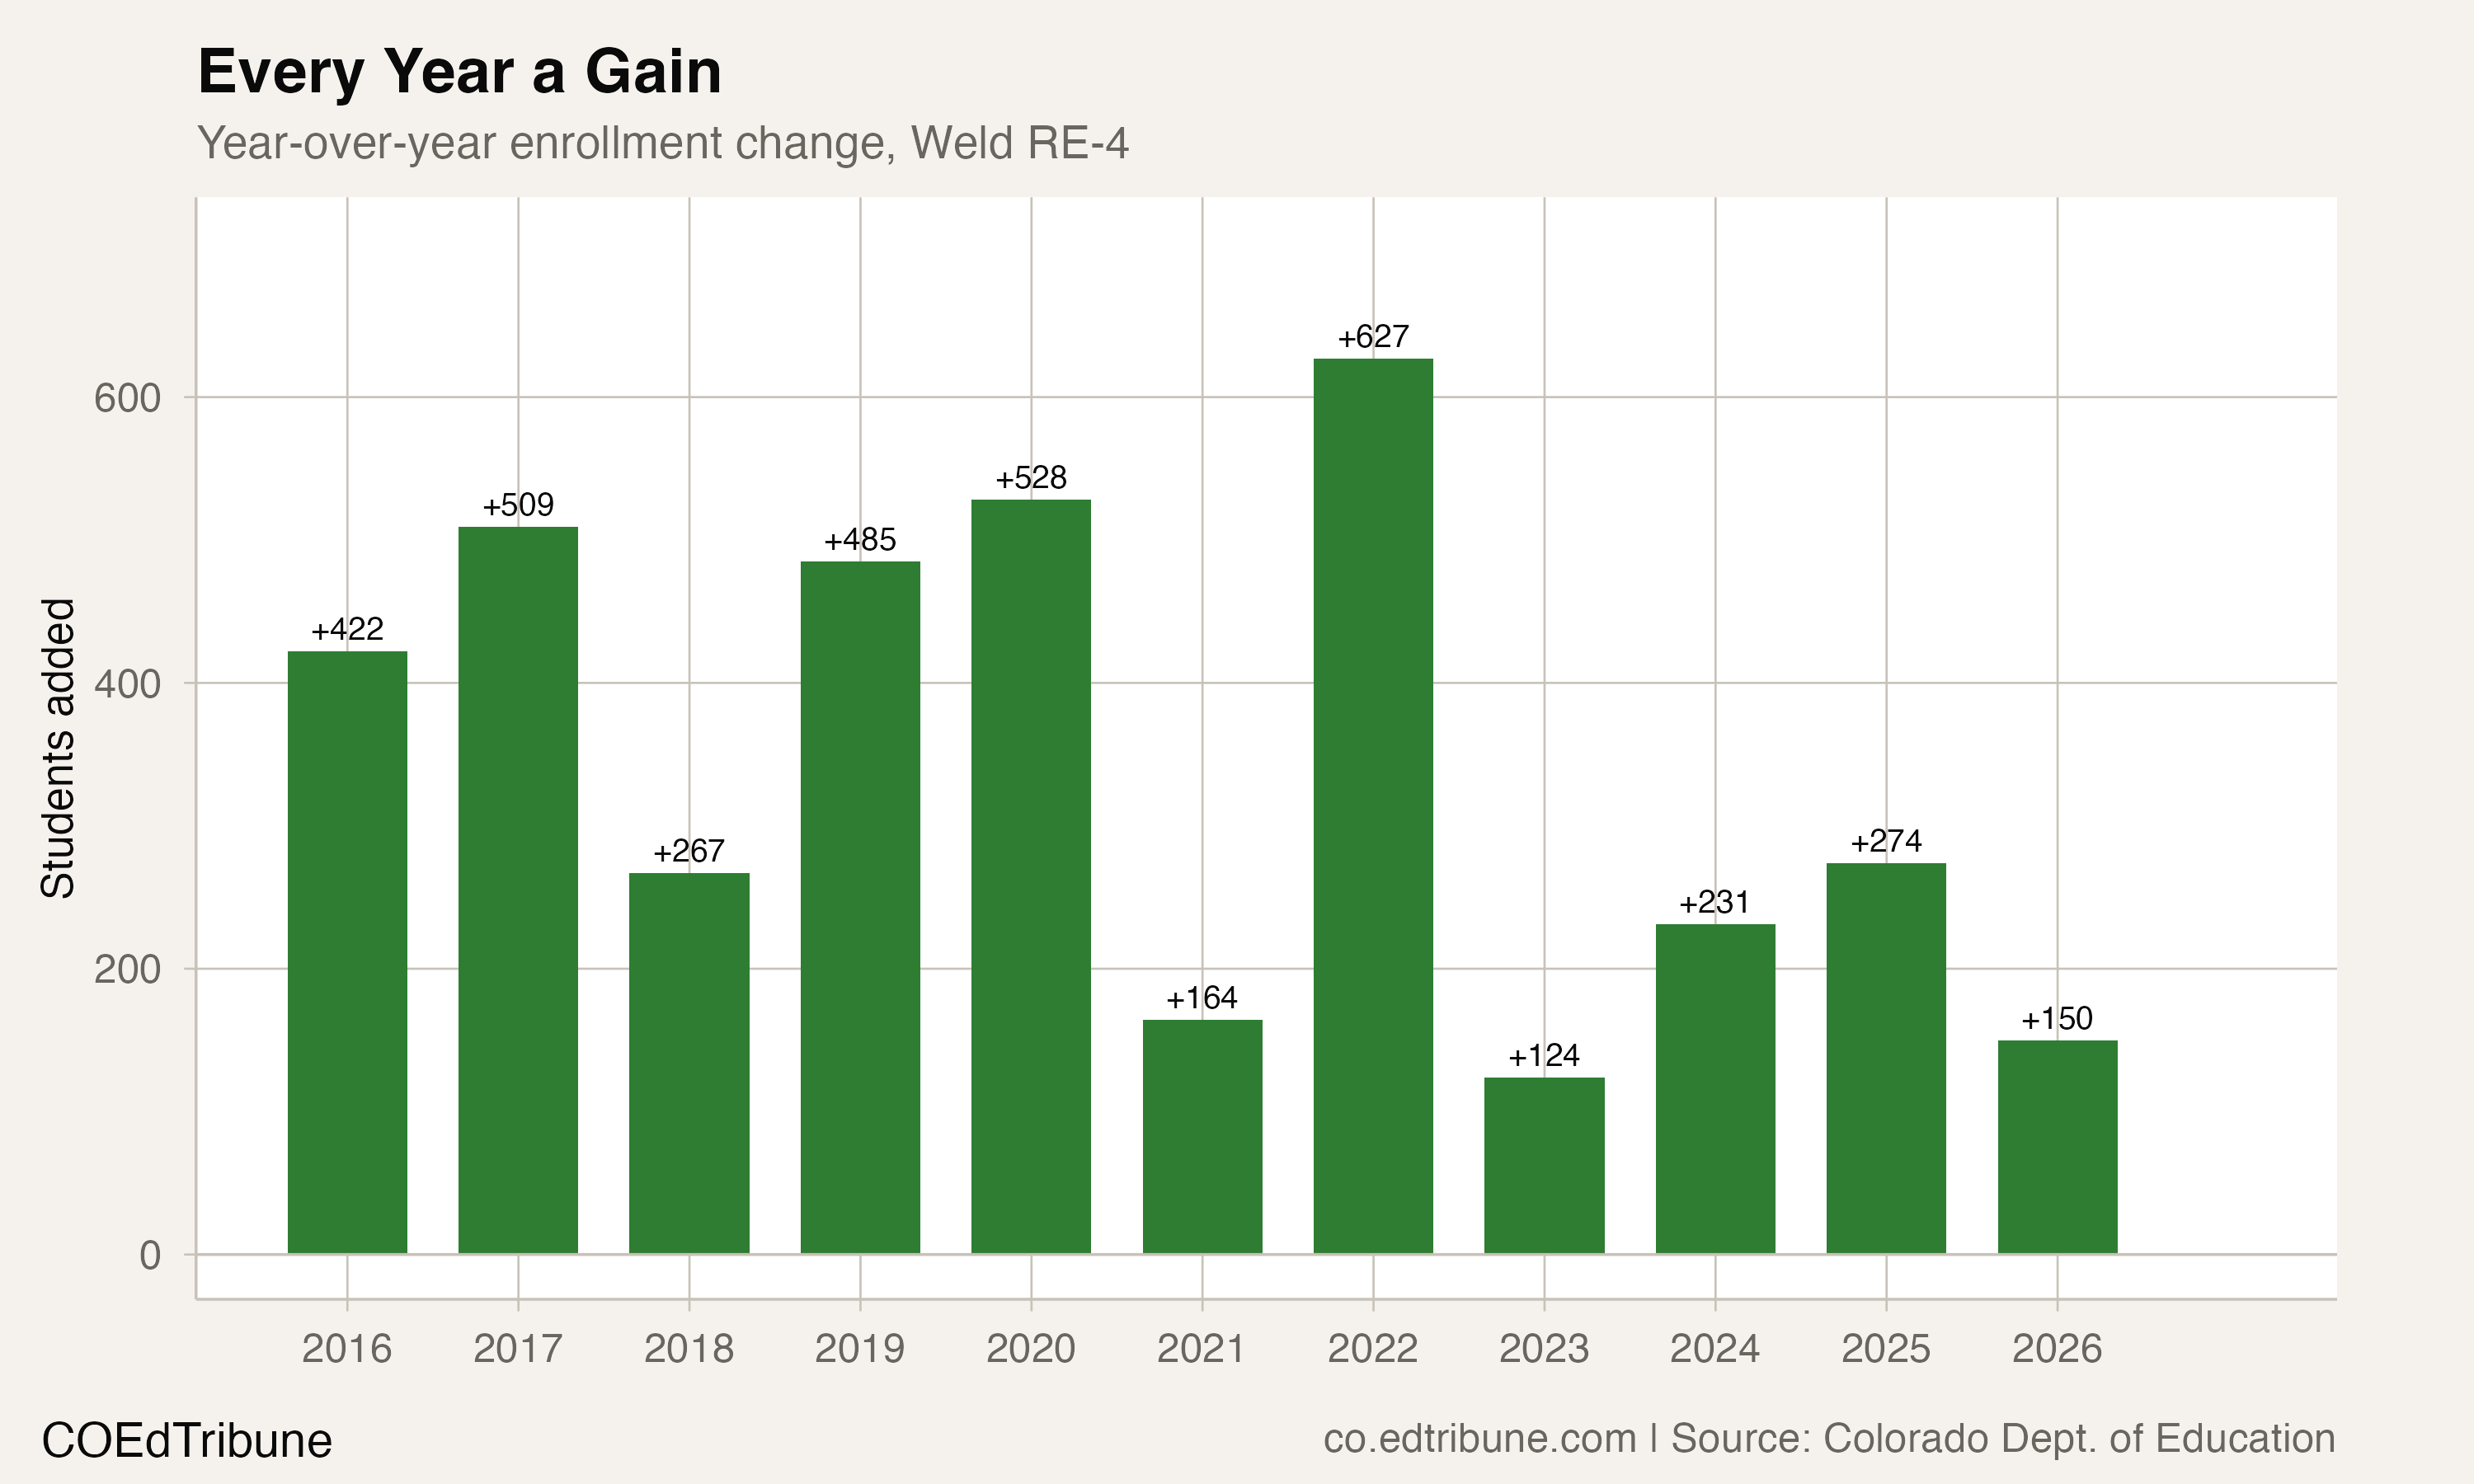
The earlier interval, from 2014–2015 to 2019–2020, averaged 442.2 additional students per annual comparison. The subsequent interval, from 2019–2020 to 2025–2026, averaged 261.7. Those averages describe the observed changes over their stated intervals; they are not forecasts or explanations for particular years.
Housing construction, family movement and school choice could matter to district membership, but these totals do not measure how much each contributed. The earlier article’s attribution of specific annual gains to construction or supply-chain conditions has therefore been removed.
District boundaries complicate a city-growth explanation
In a written response to The COEdTribune in April, Amy Lemon, executive assistant to the superintendent and school board at Greeley-Evans School District 6↗ET, emphasized that Greeley’s city boundary spans both school districts. She described the established district as “fairly land-locked and built out” and noted that much of the city’s recent growth was outside its boundary.
The response also described choice enrollment in both directions between the neighboring districts. That is useful context for why city population growth and district membership should not be treated as interchangeable. It does not establish that Weld RE-4’s measured enrollment growth was primarily residential, or quantify the contribution of transfers to the annual state counts used here.
For current family-facing information, the district’s school boundary search tool looks up an assigned school based on home address. That public resource is separate from the written response supplied to The COEdTribune.
Other named districts had different enrollment paths
The full-window comparison also includes School District 27J↗ET, Johnstown-Milliken RE-5J↗ET, Greeley 6↗ET and Poudre R-1↗ET. These are selected peers, rather than a separately defined universe of every district in a geographic growth corridor.
School District 27J rose from 17,103 to 24,290 students over the same interval, an increase of 42.0%. Johnstown-Milliken’s increase was 12.7%, and Greeley’s was 7.5%. Poudre gained 80 students, or 0.3%.
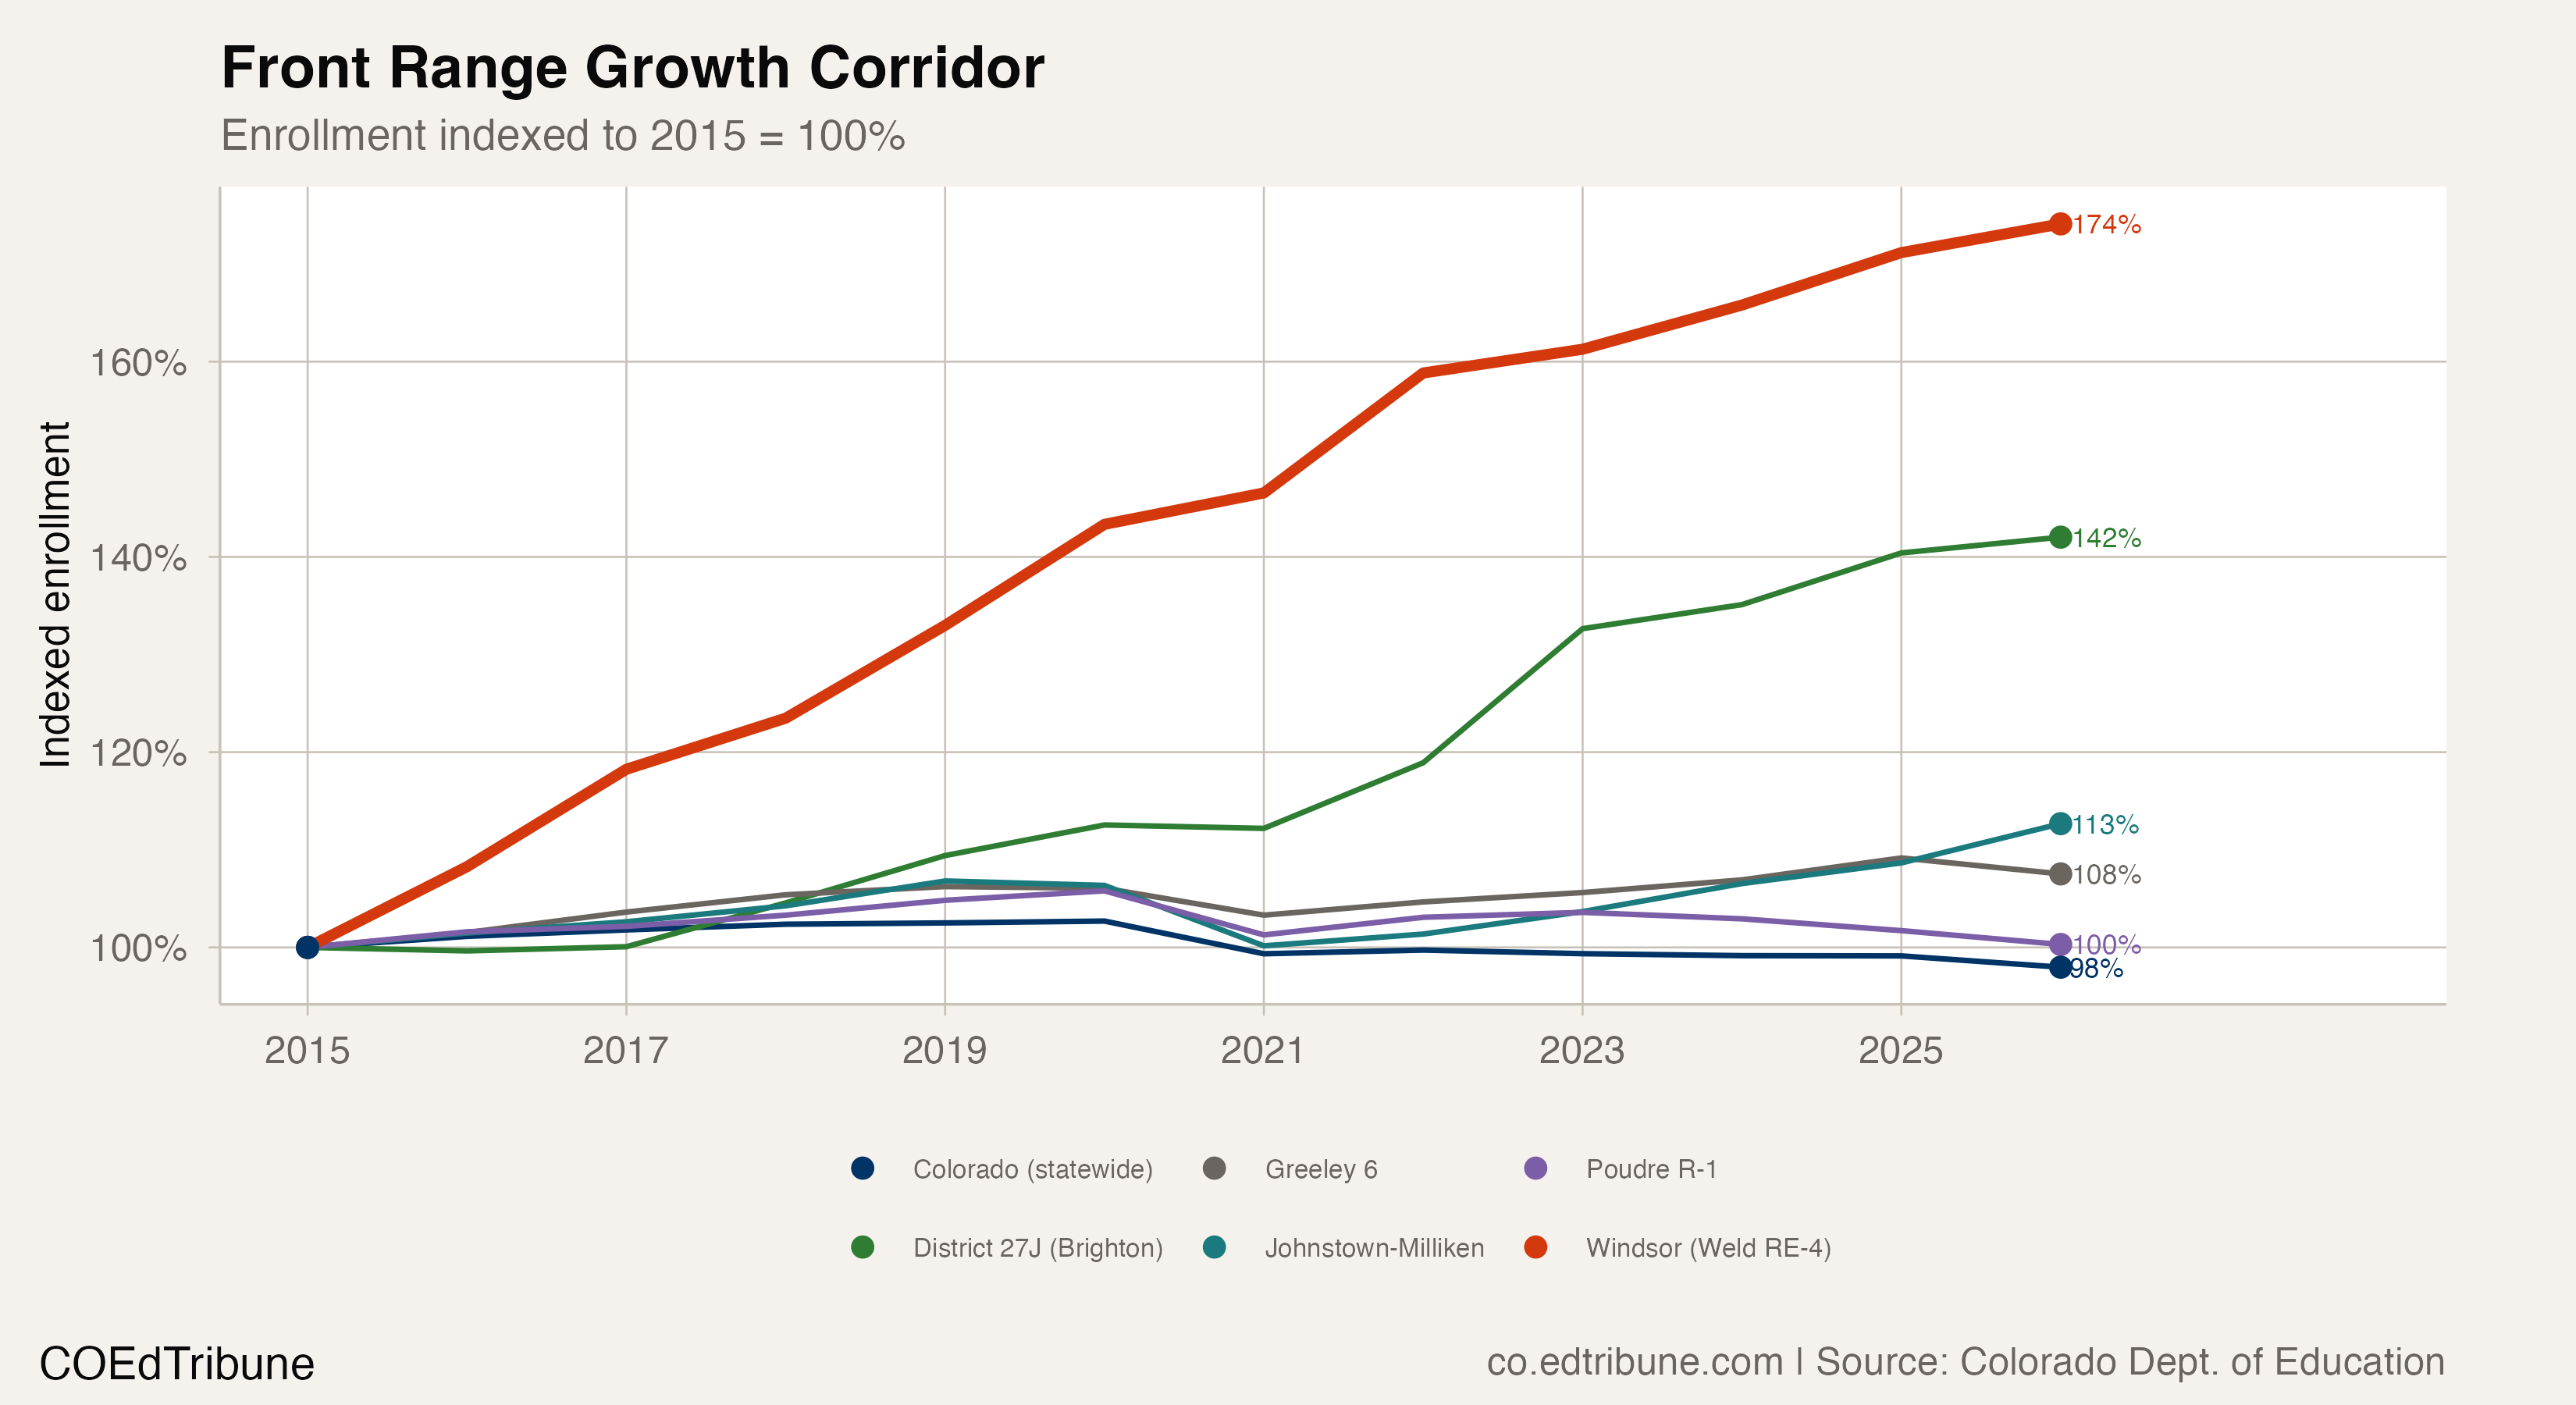
Each peer had at least one annual comparison that was flat or declining. Weld RE-4’s distinction in this checked group is its uninterrupted sequence of annual increases, rather than simply that it ended with more students than it began with.
What the enrollment sequence does and does not establish
The annual files show a district that grew throughout the checked period, including years when statewide enrollment fell. They also show a smaller average annual addition in the later interval and a relatively small most recent gain.
That is enough to frame a planning question about how the district responds to changing membership. It is not enough to assign every addition to new housing, infer the number of future incoming students, or state that a particular capital or operating budget consequence must follow. The verified streak describes what happened; the next published year will determine whether it continued.
Detailed code that reproduces the analysis and figures in this article is available exclusively to EdTribune subscribers.
Discussion
Sign in to join the discussion.
Loading comments...