Thirty-six Colorado education agencies had chronic absence rates below the State’s in every year from 2022-23 through 2025-26. The comparison covers 94 agencies with complete attendance counts and rates and at least 500 students in their published attendance populations in each of those four years.
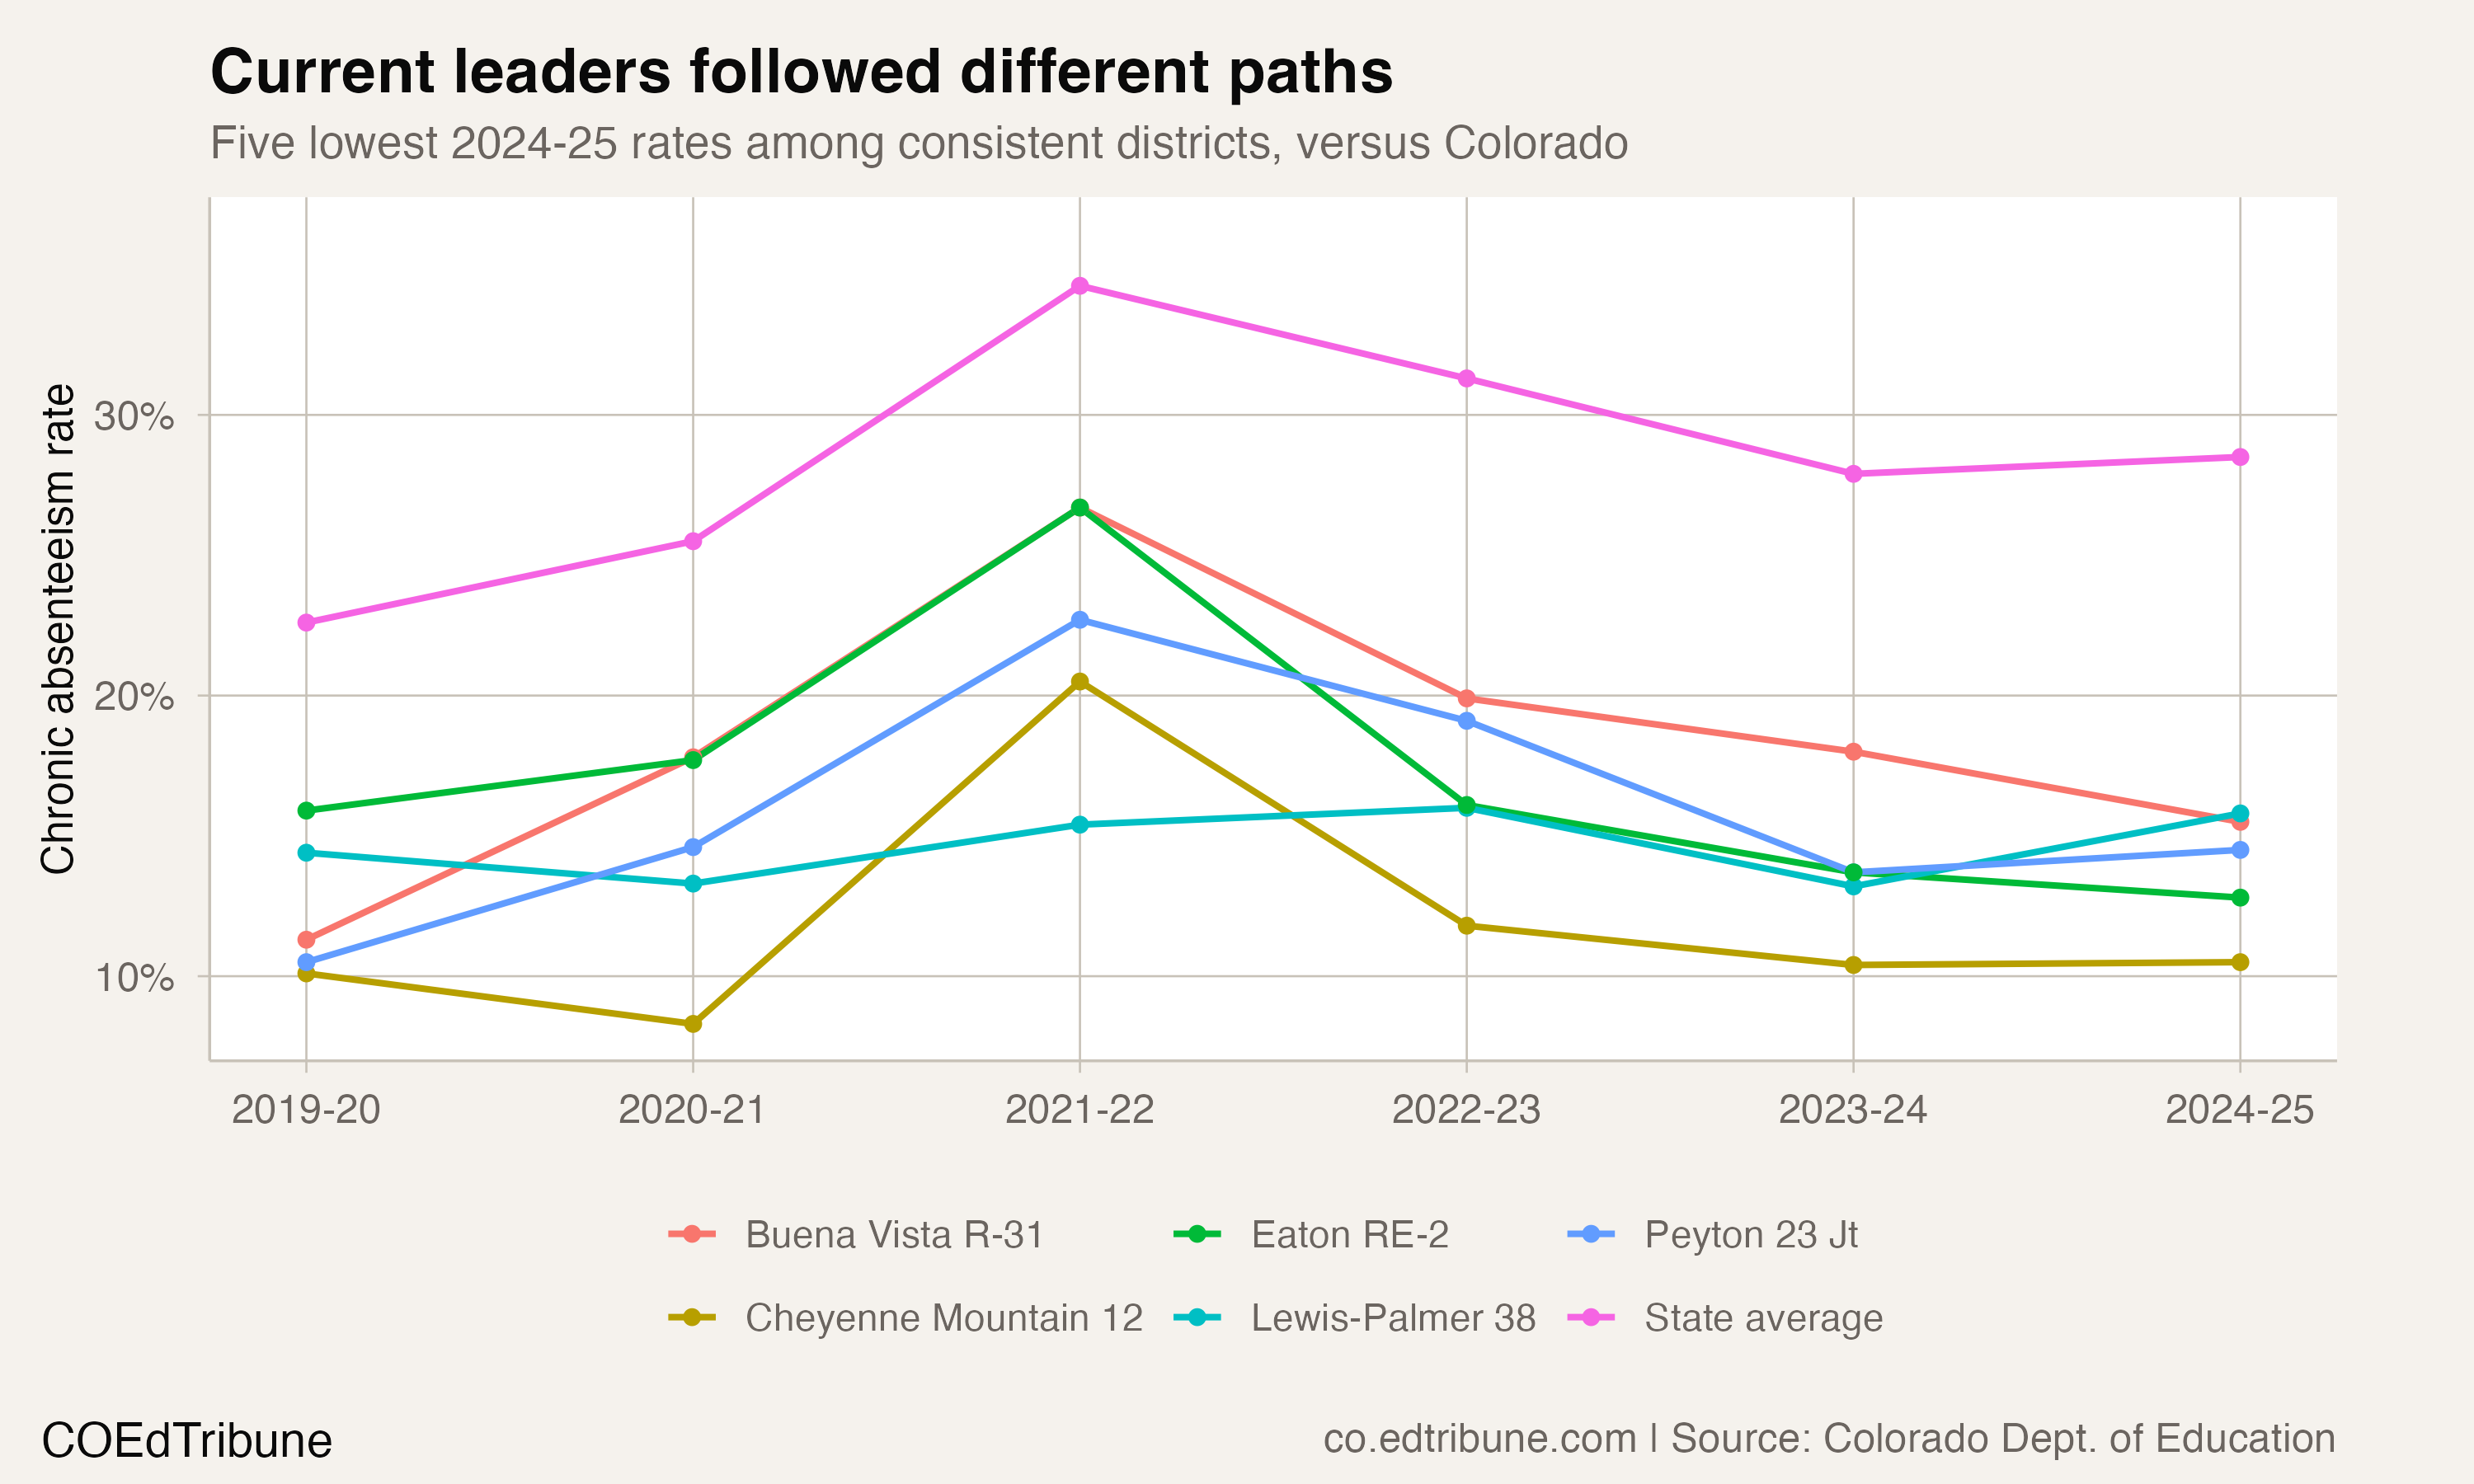
For Cheyenne Mountain 12↗ET, the most recent published year brought a 9.5% rate, down from 10.5% a year earlier. The district reported 356 students classified as chronically absent in 2025-26, out of an attendance population of 3,756. Colorado’s rate was 27.5%.
Assistant Superintendent Stacy Aldridge described the district’s work in written answers supplied through Superintendent David Peak: “Without exception, families are contacted every day if students are absent from school.” Her response described staff exploring barriers with families, free elementary breakfast, extended high school hours and a welcoming response when students return. Office staff greet a returning student with “It is great to see you.”
Aldridge subsequently confirmed that the chronic absence figure she supplied referred to 2025-26. That year is now included in the state attendance reports used here. The district’s account describes its practices; the annual attendance figures do not establish their effect.
A comparison with explicit limits
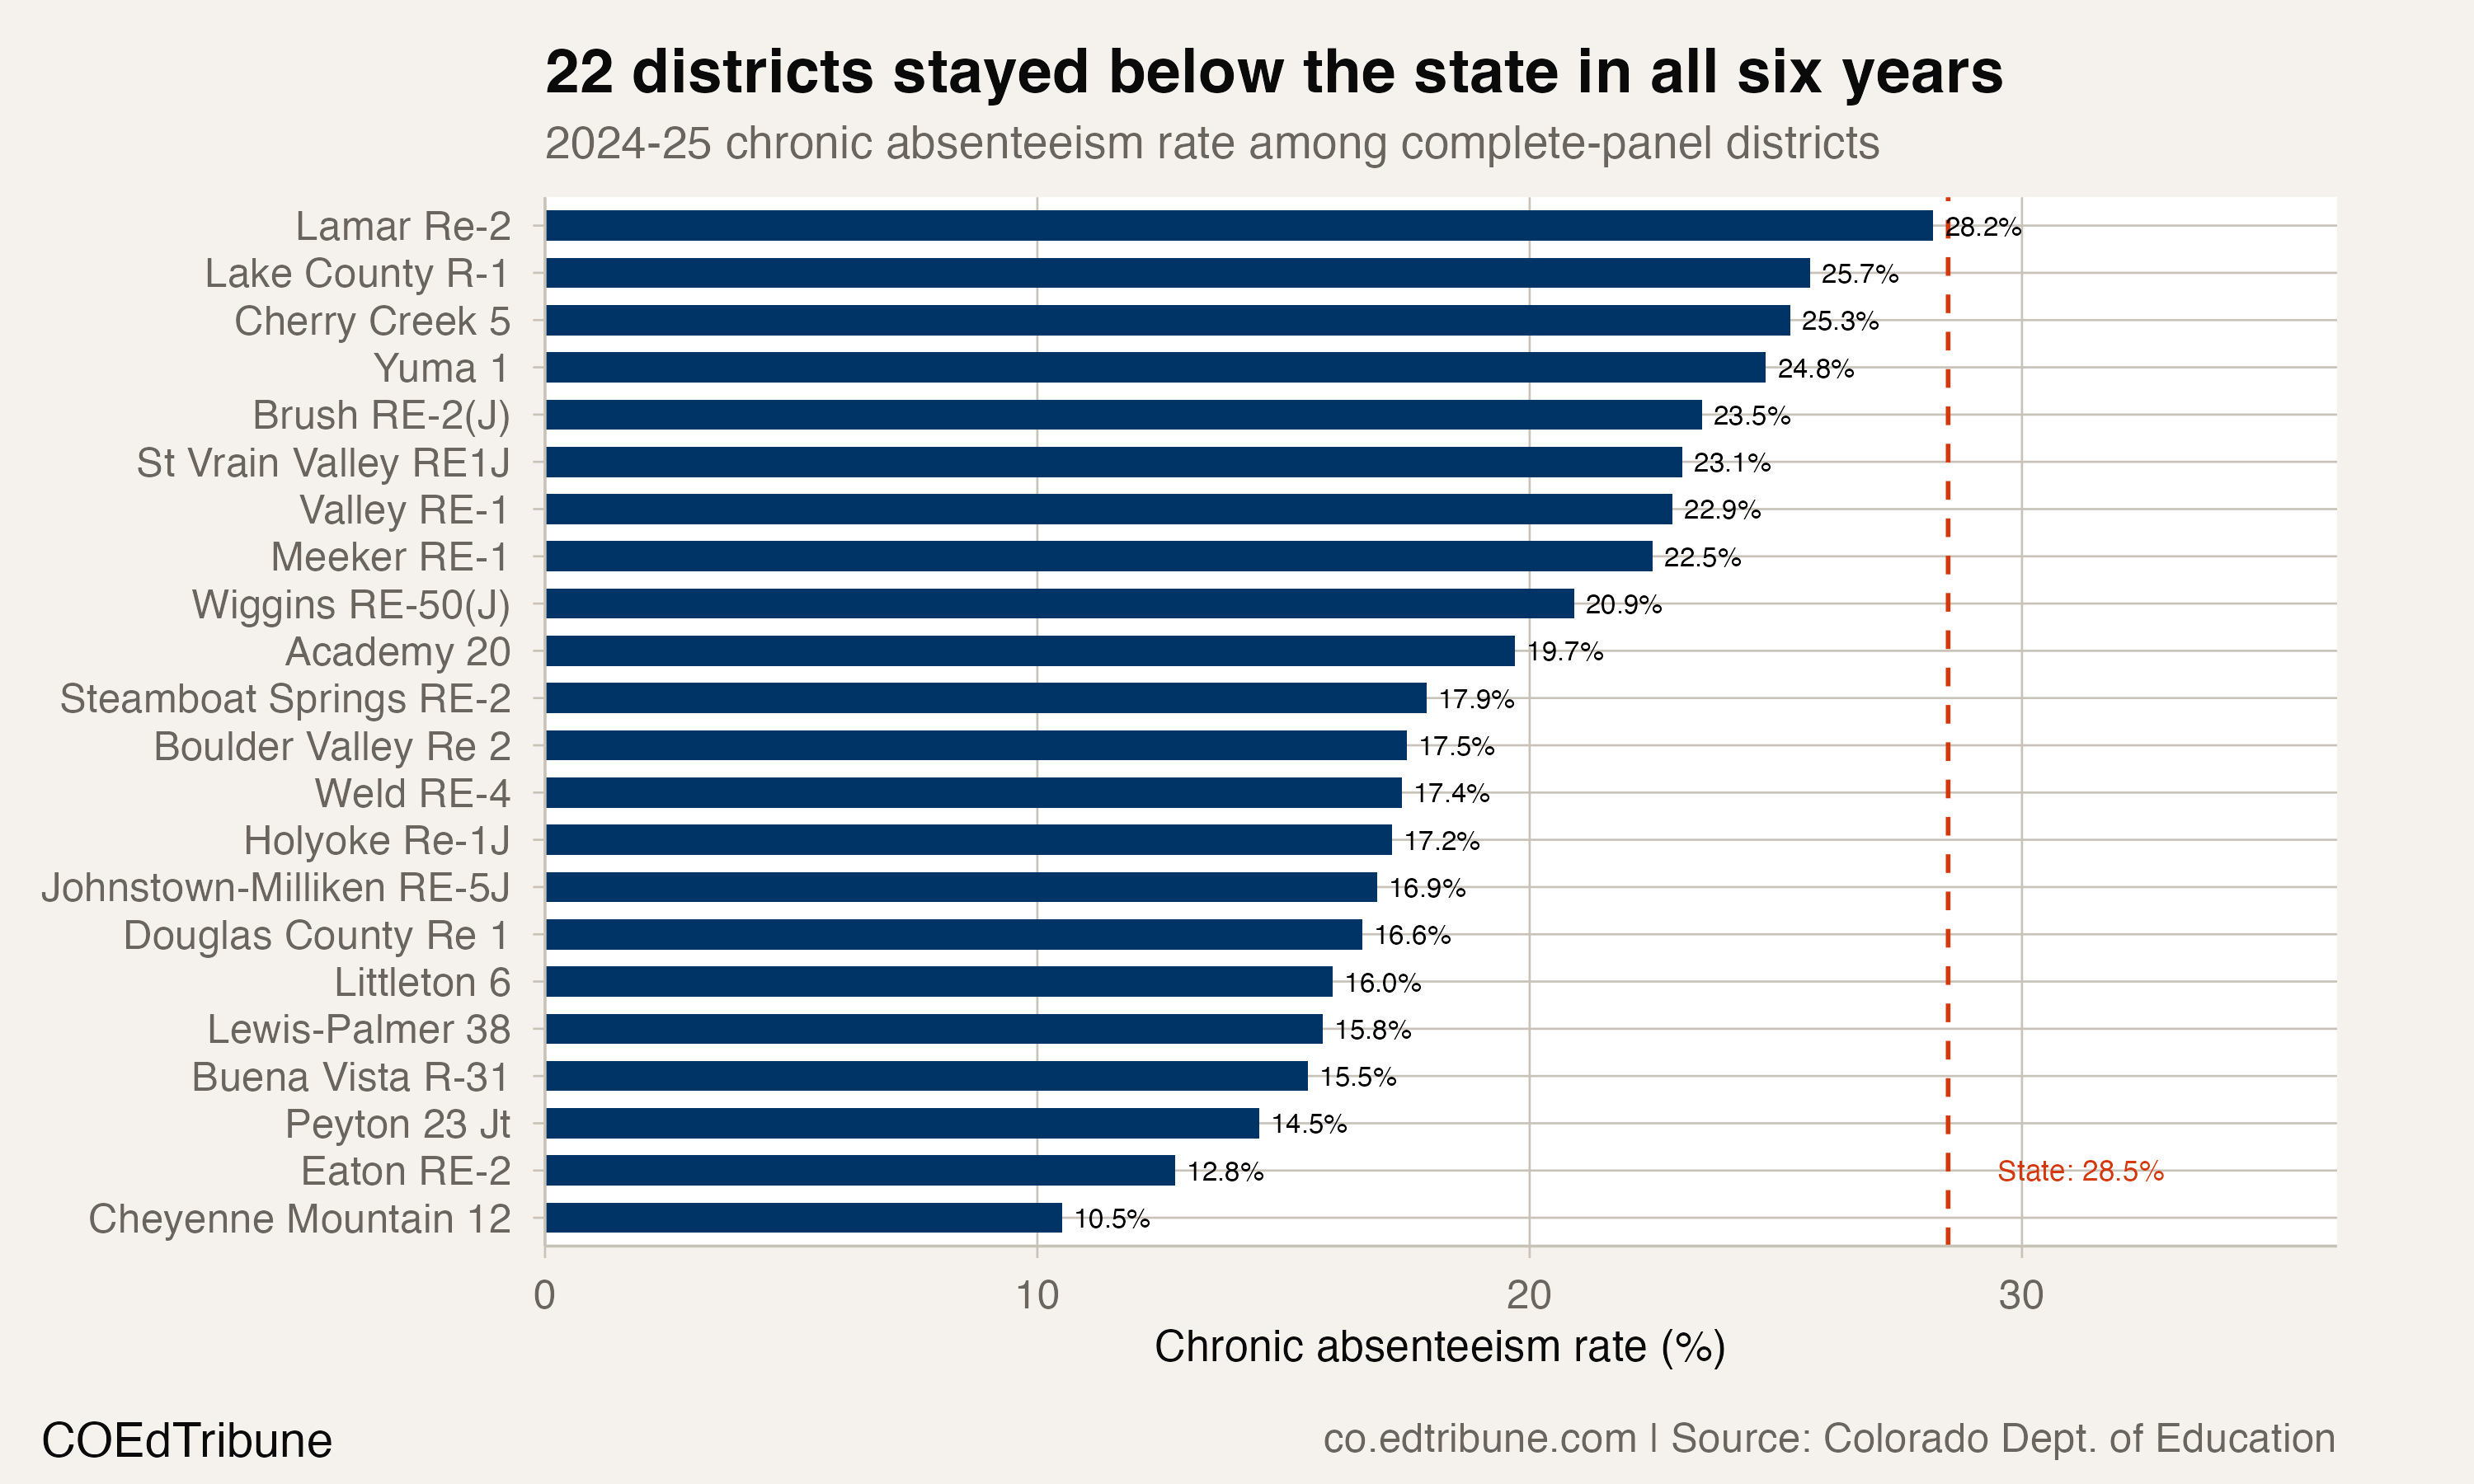
The reporting universe includes the Colorado Charter School Institute↗ET and other education agencies alongside geographic districts. Each agency is compared with the State rate for the same school year. The four-year window follows the change in Colorado’s attendance-counting rules, so this article does not average rates across that break.
The 500-student minimum is an editorial cutoff applied in every year, using attendance-reporting populations. Those populations are not fall enrollment. Without a size cutoff, 72 of 177 agencies with complete, positive attendance populations met the below-State test. A floor of 250 gives 50 of 128; a floor of 1,000 gives 26 of 68. Independently deduplicated agency populations cannot be added to determine how many unique Colorado students those comparisons cover.
Changing the time window also changes the result. Within the same minimum-population rule, 40 agencies stayed below the State for the latest three reporting years and 44 for the latest two. These are different tests, not evidence that the four-year set gained members over time.
Below the State does not mean a falling rate
Twenty-seven of the 36 agencies had lower rates in 2025-26 than in 2022-23. Nine had higher rates, despite remaining below the State in every year.
Meeker RE-1↗ET shows the distinction. Its rate rose from 16.8% in 2022-23 to 22.5% in 2024-25, then fell to 20.9% last school year. The latest decline leaves the rate above the start of the comparison. Cheyenne Mountain’s path also included a small intervening rise, from 10.4% to 10.5%, before its latest decline.
Colorado’s attendance strategy guidance calls for collecting and analyzing data, family and community partnerships, and tiered support. The attendance tables do not record which agencies used those approaches, how broadly they reached students, or whether the same practice explains different local results.
Different attendance populations, the same test
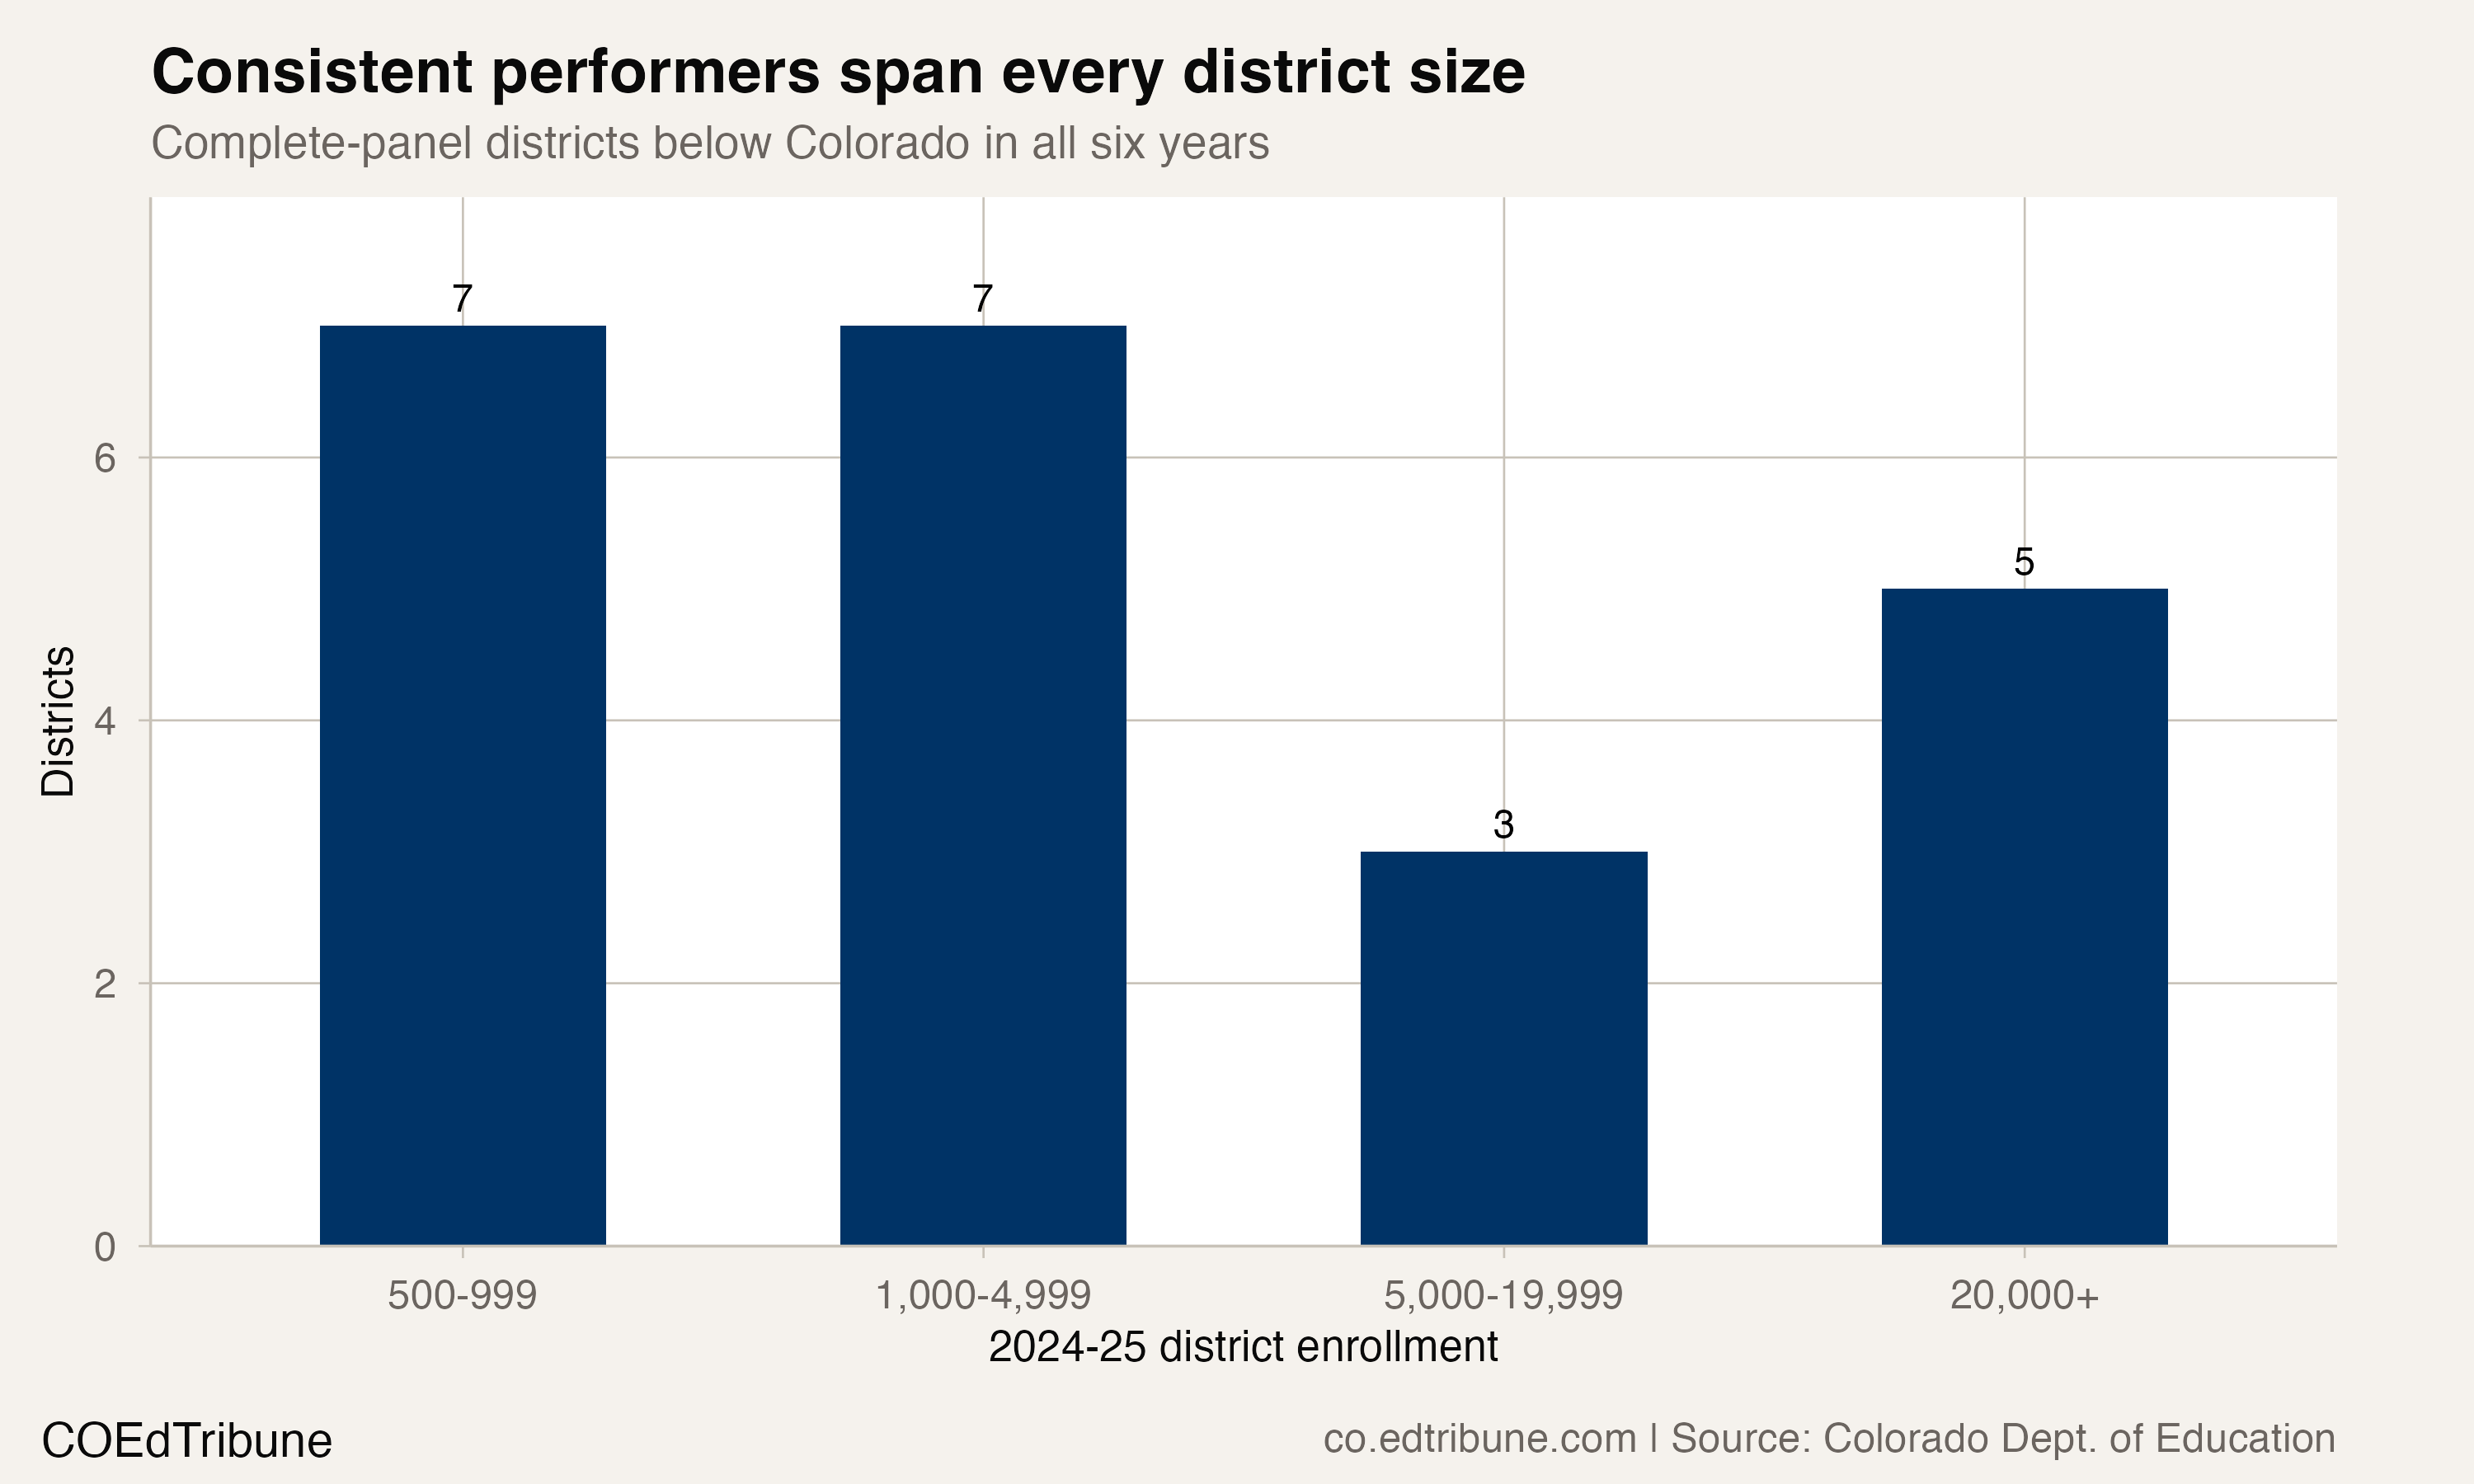
The set spans attendance populations from 535 in Holyoke Re-1J↗ET to 72,640 in Jefferson County R-1↗ET. Six qualifying agencies had at least 20,000 students in their latest attendance populations. The size chart uses the same 36-agency set, not a separate enrollment comparison.
A below-State rate identifies a relative position. It does not show that students no longer miss substantial amounts of school, that an agency’s own rate is improving, or that the agencies share an explanation. Cheyenne Mountain’s description of daily contact gives a specific account of attendance work in one district. The four-year comparison cannot supply that account for the others.
Correction, October 28, 2026: This article now uses four years with matching attendance-counting rules. Its count and comparison group therefore differ from the previous six-year list. Cross-definition averages are withdrawn, attendance populations previously labeled enrollment are corrected, and historical State rates and the outdated claim of uninterrupted increases in Meeker are corrected. The most recent published year is now included.
Chronic absence figures come from the Colorado Department of Education’s attendance reports.
Detailed code that reproduces the analysis and figures in this article is available exclusively to EdTribune subscribers.
Discussion
Sign in to join the discussion.
Loading comments...