Correction (October 8, 2026): Rechecking the original annual files changed several historical counts and derived changes. The article now limits its threshold comparison to the checked history and removes unsupported explanations, district-ranking claims and predictions.
White students accounted for 49.0% of Colorado's 870,793 public-school students in 2025–2026, last school year's membership and the most recent published data. None of the state's reported racial or ethnic categories exceeded half of that total.
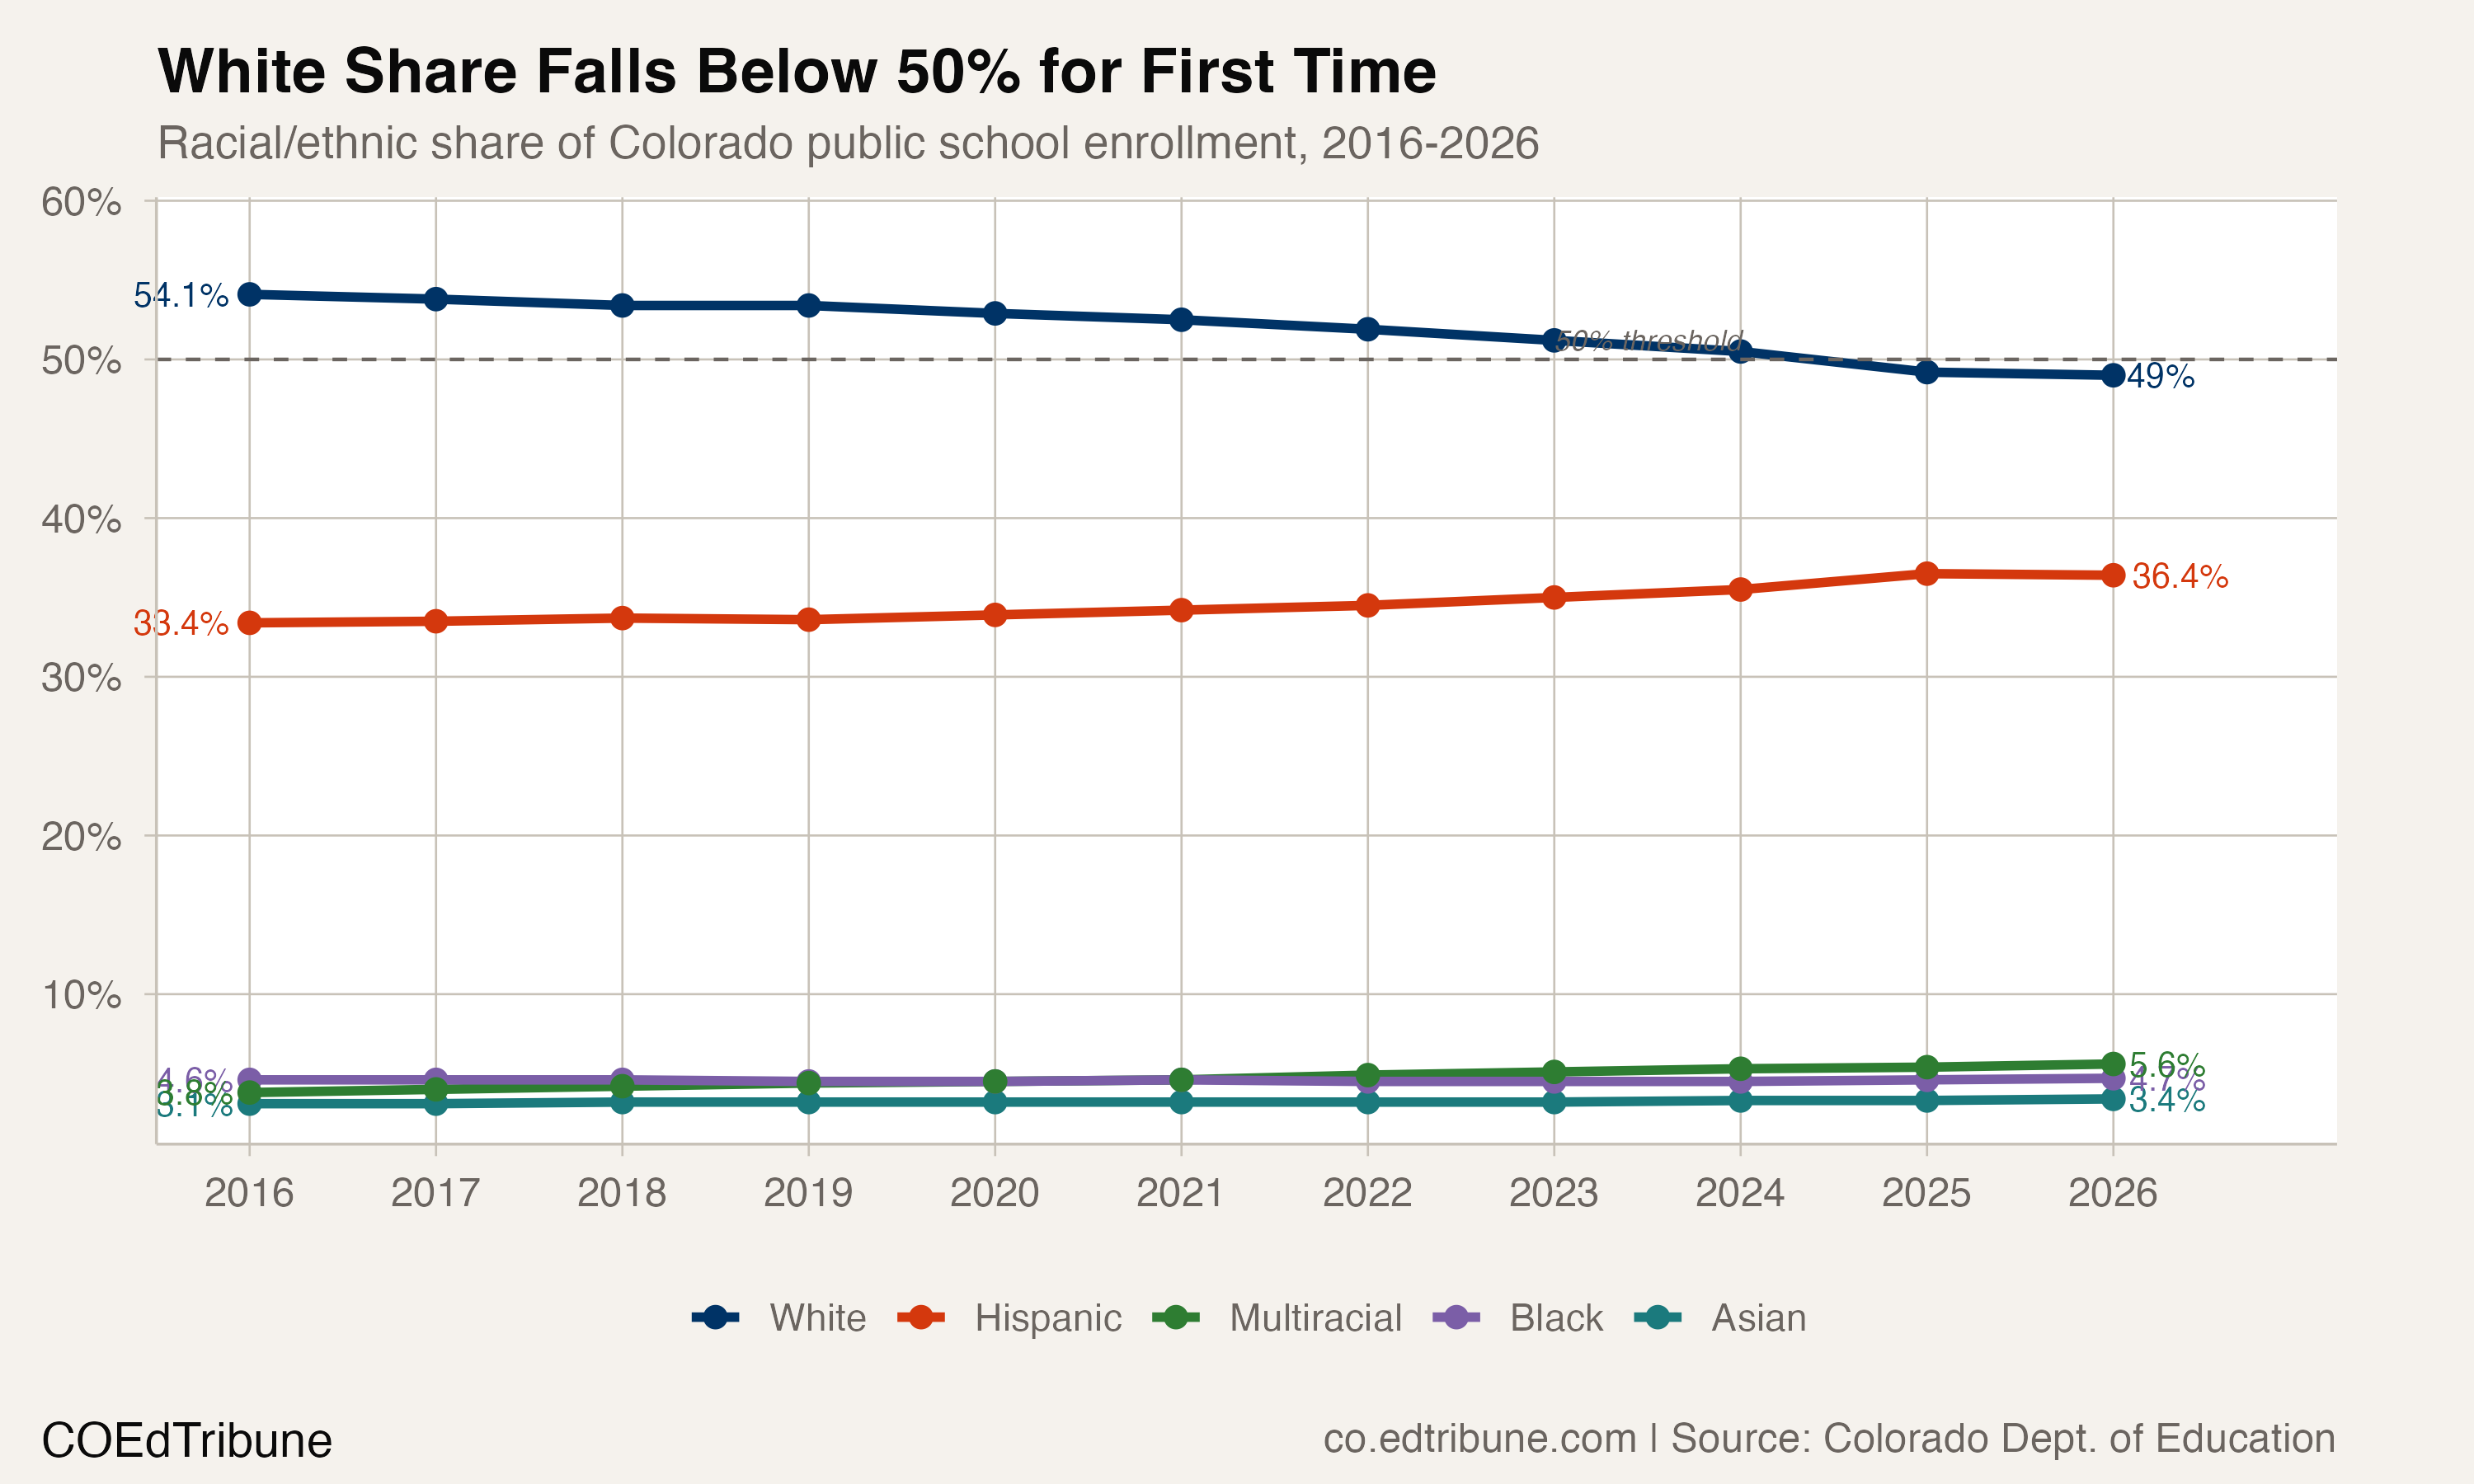
Within the original annual-file history from 2014–2015 through 2025–2026, White enrollment first fell below half in 2024–2025, at 49.2%. That is the first crossing in the checked window, rather than a claim about the full history of Colorado schools.
The Colorado Department of Education's membership page links the annual collection. Each percentage here uses the same year's published enrollment total. The original annual files are kept as one consistent history rather than mixed with later landing-page revisions.
Counts and shares measure different changes
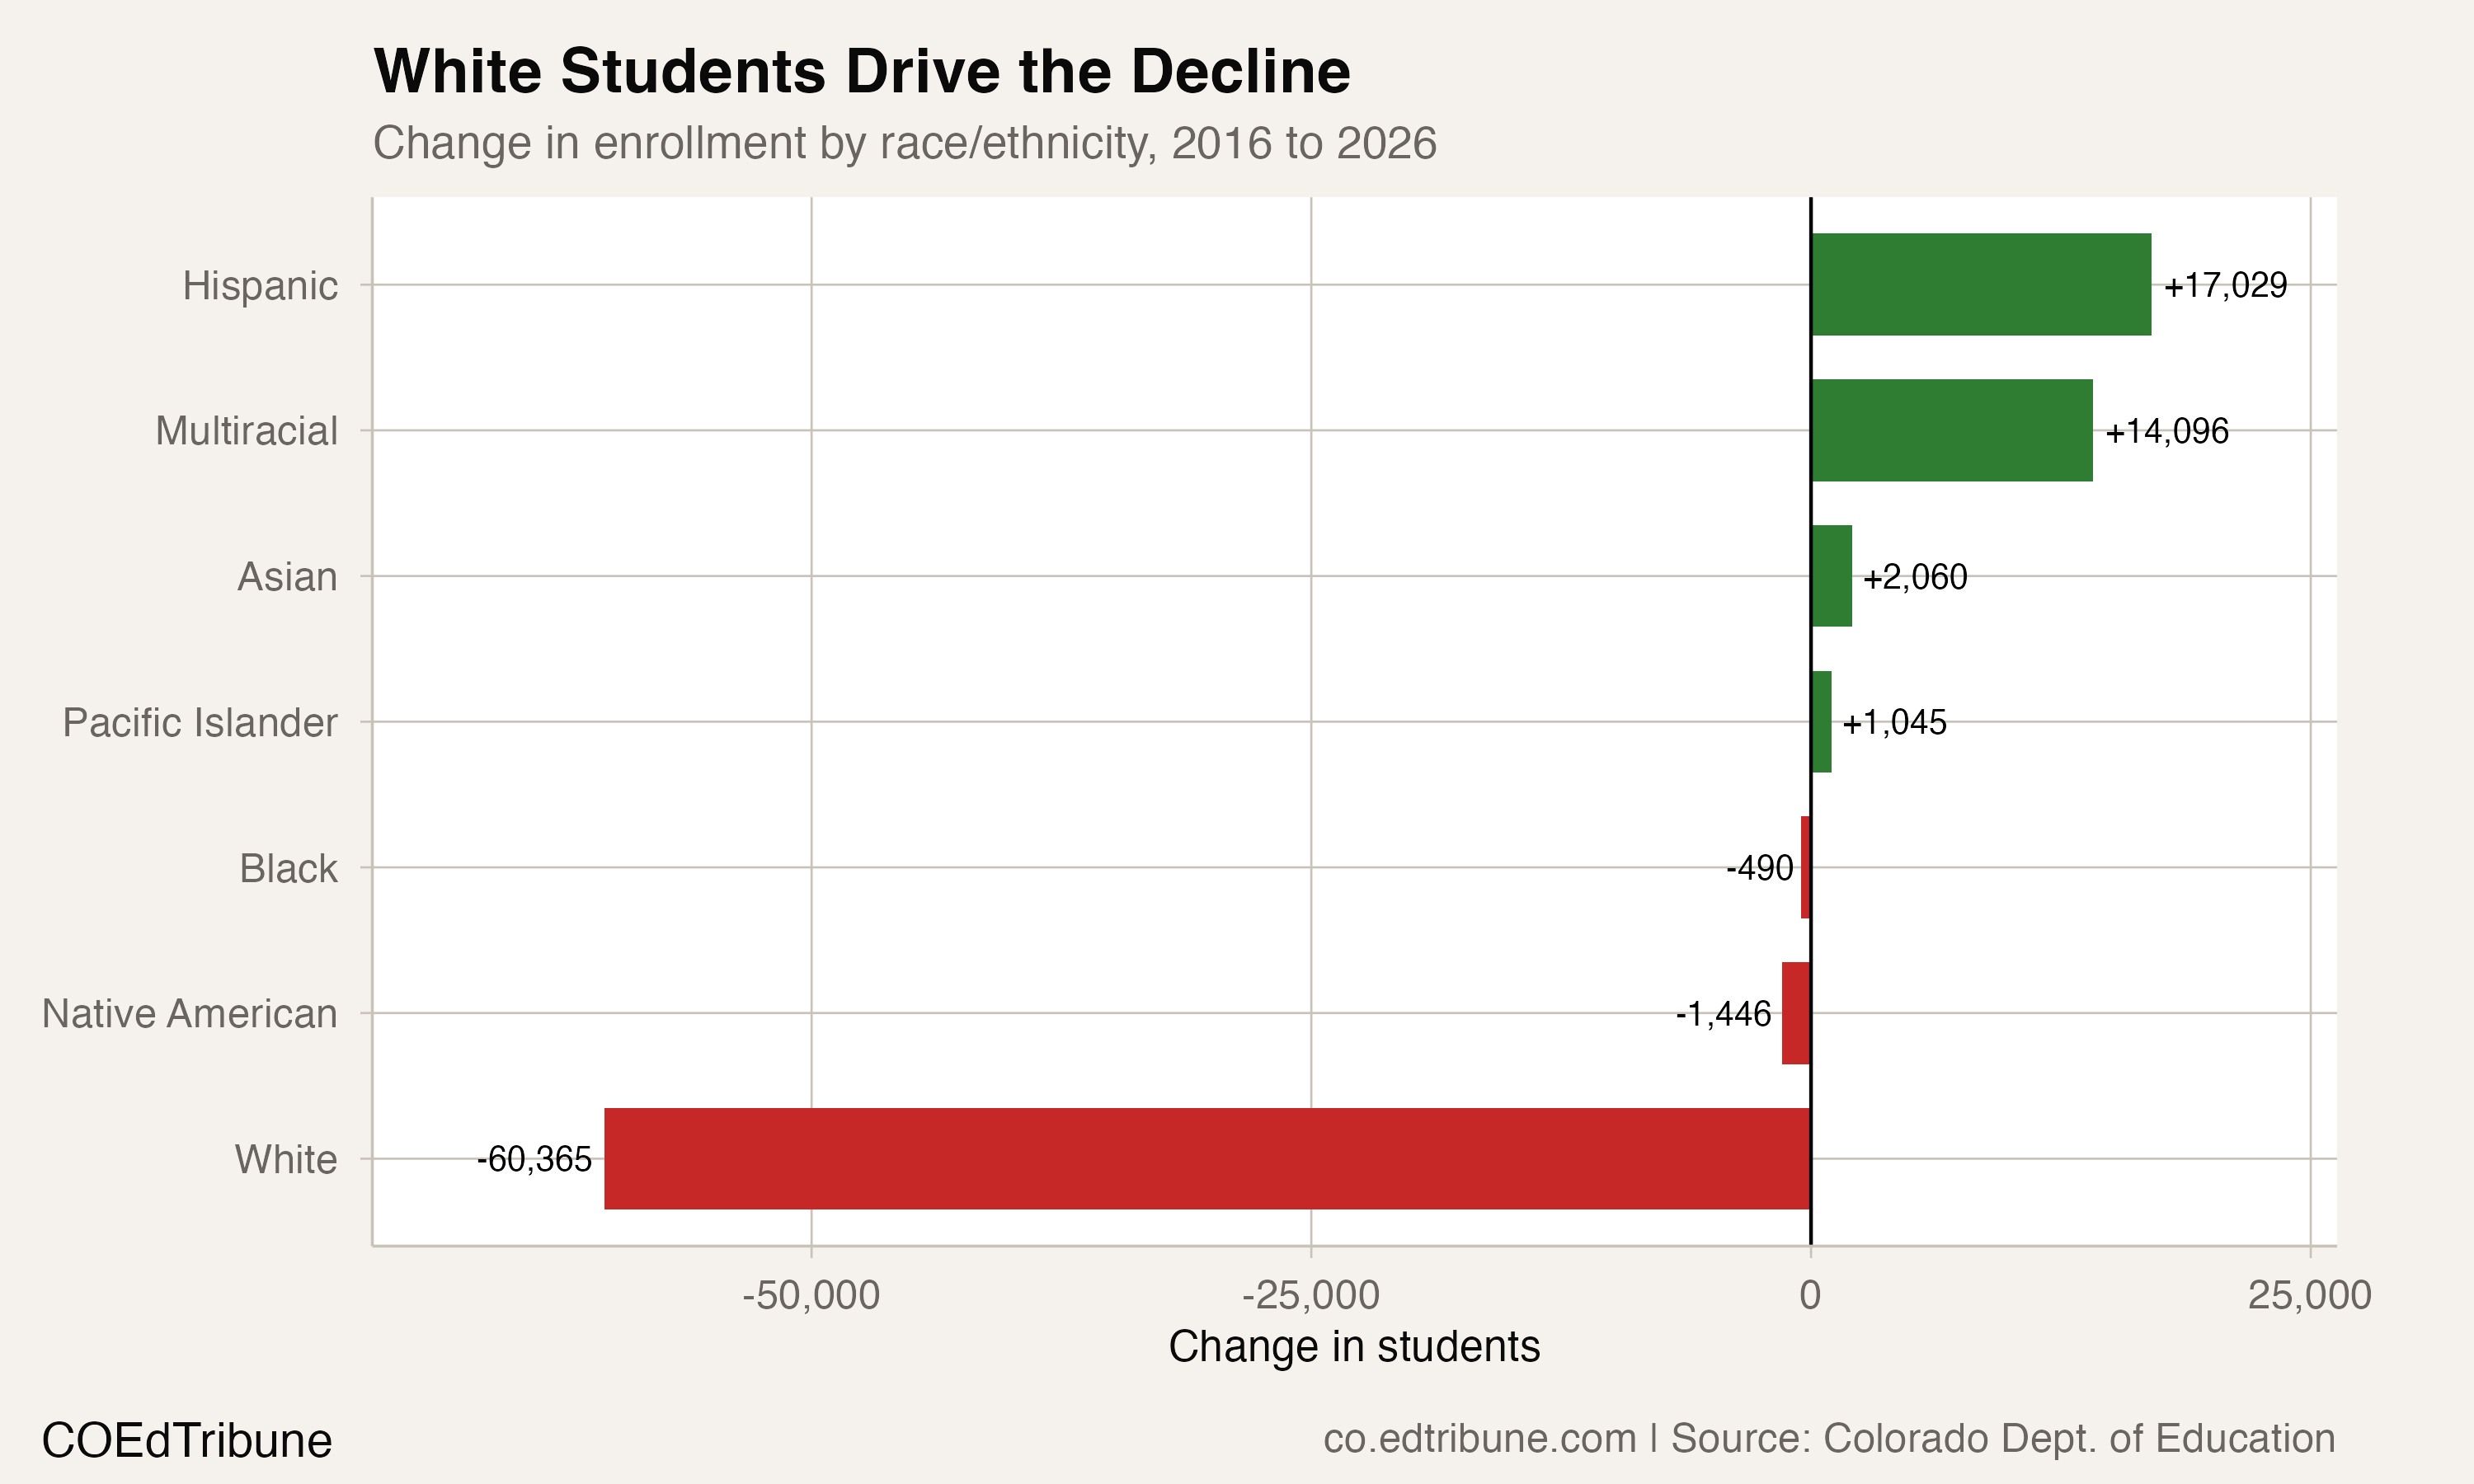
White enrollment declined from 486,818 students in 2015–2016 to 426,362 in 2025–2026, a loss of 60,456 students, or 12.4%. Its share fell from 54.1% to 49.0%, a change of 5.2 percentage points calculated before rounding the endpoint shares.
Hispanic enrollment increased from 300,107 to 317,014 over that same interval, a gain of 16,907 students. Yet the most recent annual comparison moved in the other direction: the original-file history peaked at 321,409 Hispanic students in 2024–2025, before falling by 4,395 the following year. The final-year share was 36.4%.
Multiracial enrollment rose from 34,393 to 48,485 students, a gain of 14,092, or 41.0%. It represented 5.6% of the final-year total.
A category's share describes its count relative to all enrolled students. A rising share alone does not show that its count rose in every annual comparison, and a declining count does not establish why individual students left.
Kindergarten has its own published base
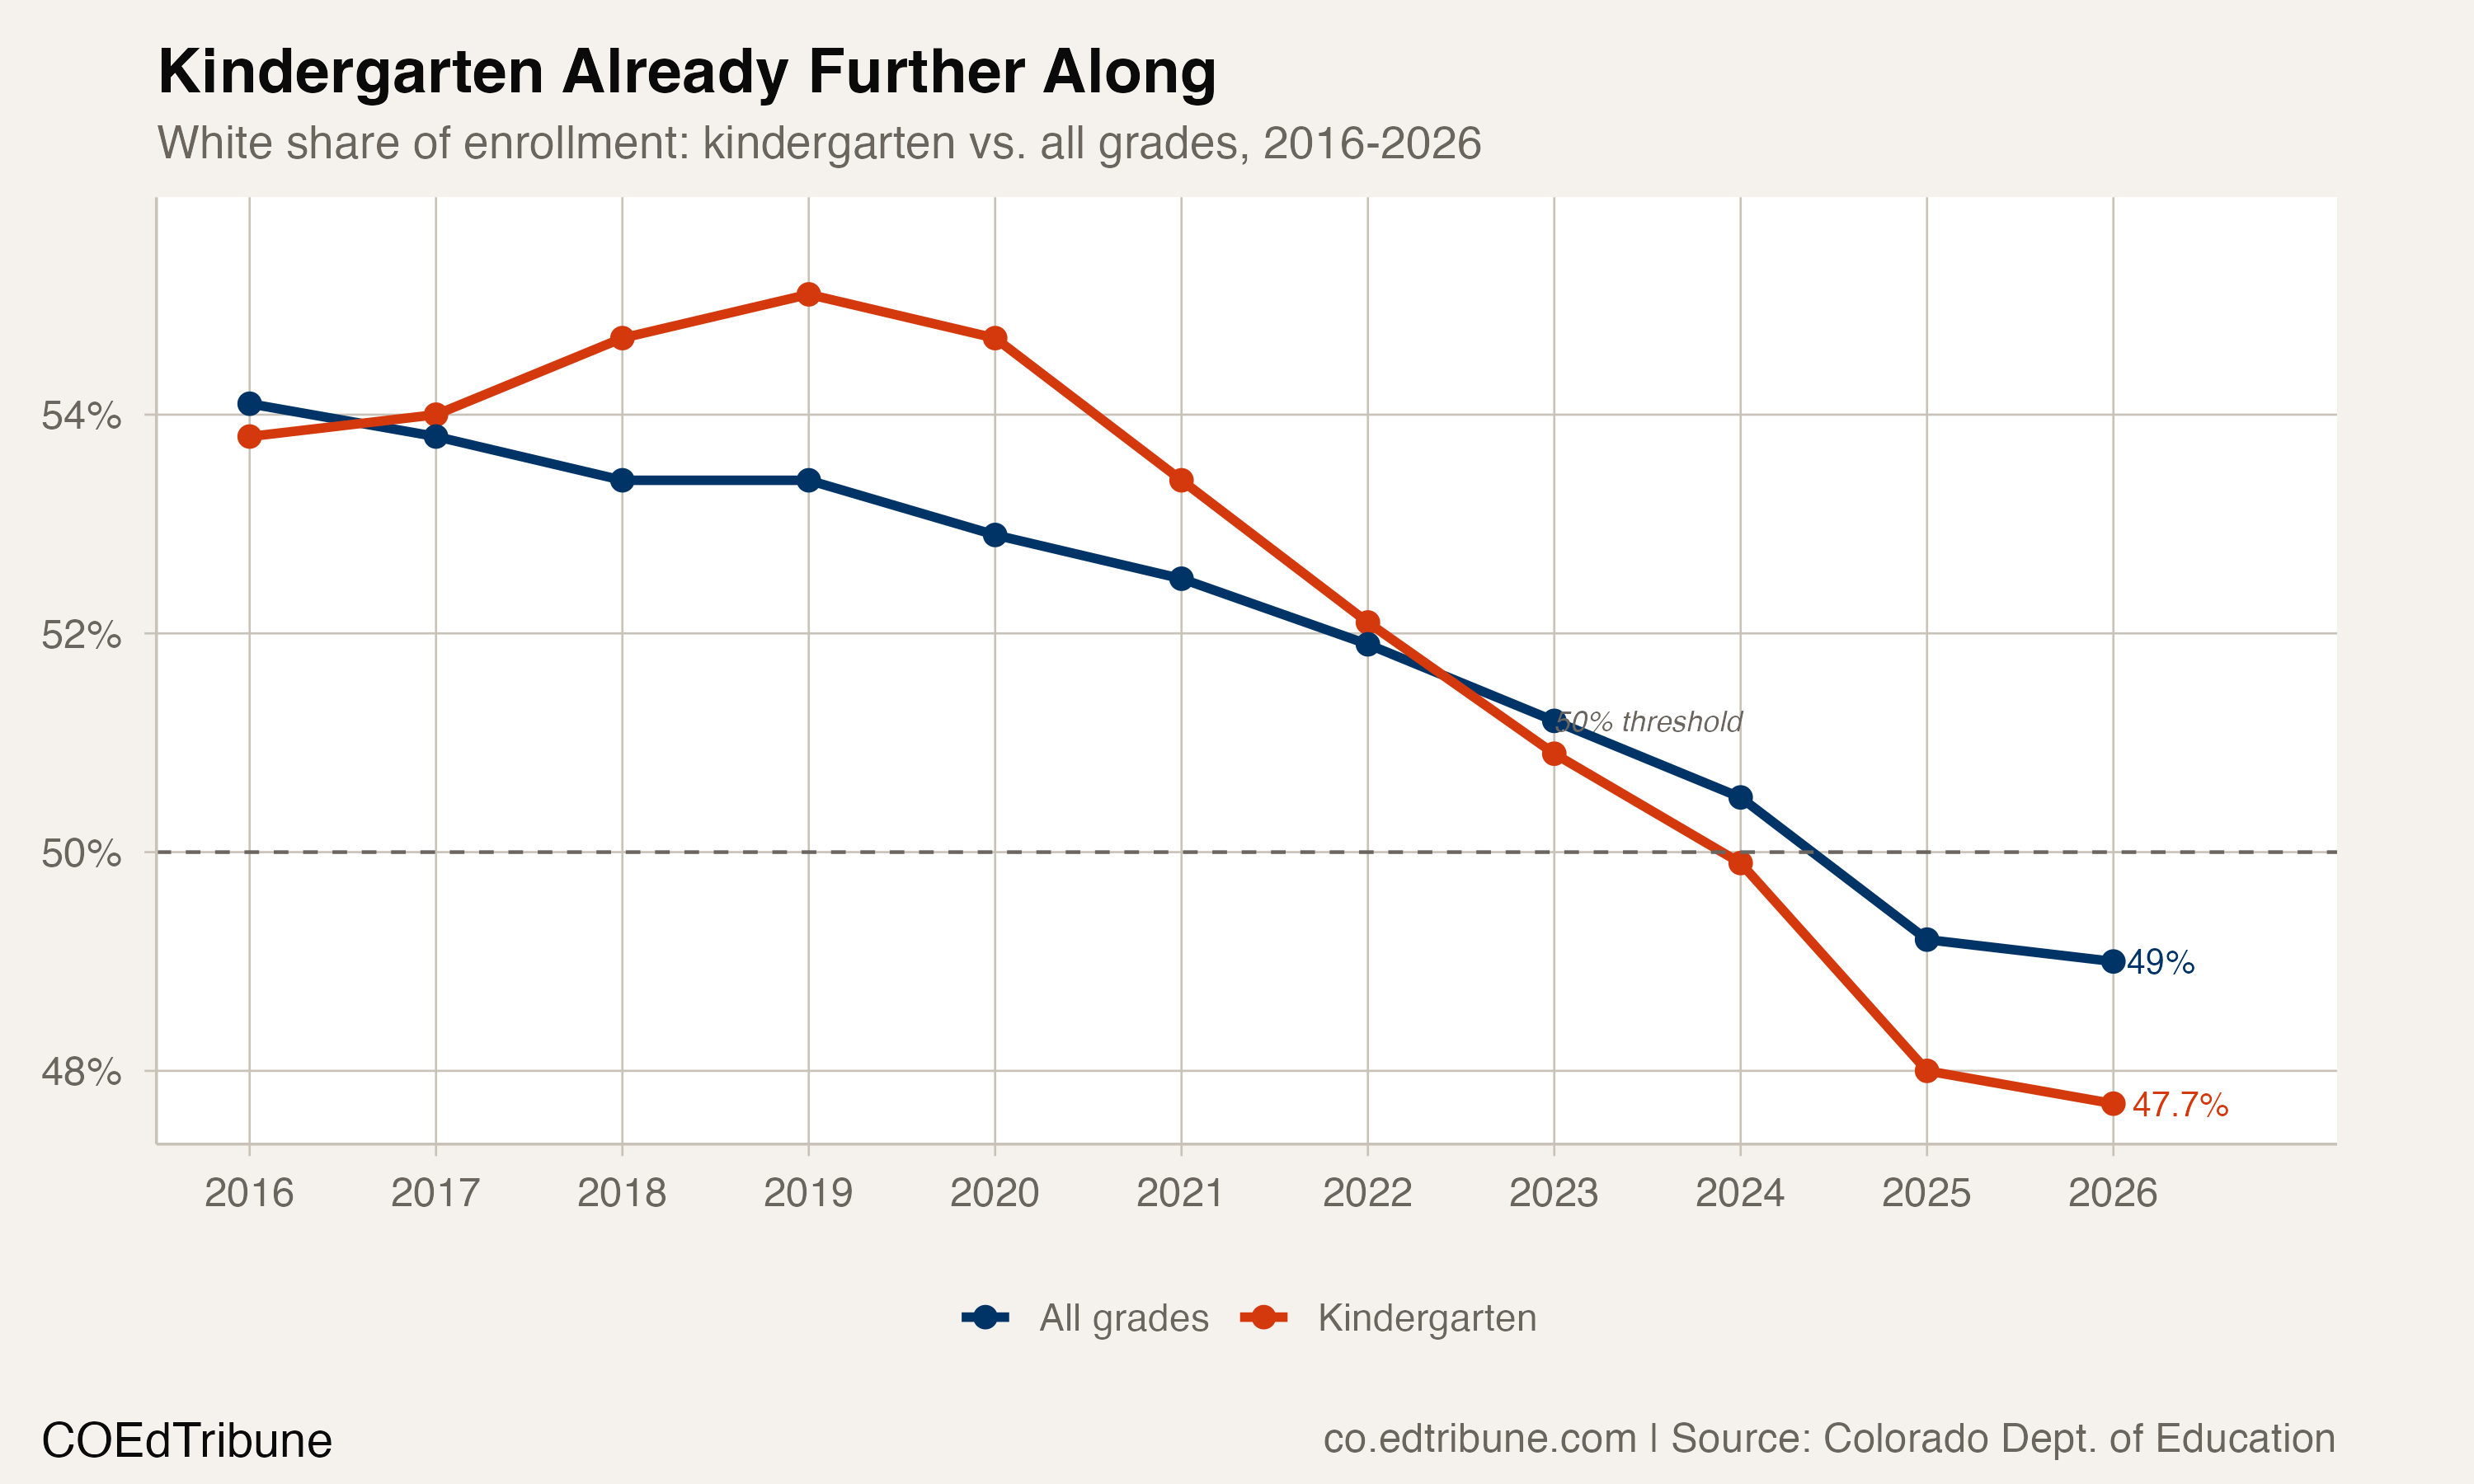
White kindergarten membership declined from 34,785 students in 2015–2016 to 27,385 in 2025–2026, a drop of 21.3%. Its final-year share was 47.7% of published kindergarten enrollment, compared with 49.0% across all grades. The difference was 1.3 percentage points.
Those percentages describe different grade populations, each with its own published total. They do not predict the statewide share when those kindergartners reach later grades: transfers, cohort changes and future enrollment are not resolved by the present comparison.
What the records establish
The reported race categories reconcile to the published enrollment total throughout the checked history at the statewide and kindergarten levels. The percentage denominator is that independently published total, rather than a sum used to inflate visible categories to a full distribution.
The records show changes in reported category membership. They do not distinguish population change, school transfers or changes in how families identify students. Without that evidence, a birth-rate explanation or a reclassification explanation cannot be assigned a share of the change.
The measured threshold crossing and category counts stand on their own. Later annual records will show whether the recent shares rise or fall; the present history does not establish their future direction.
Detailed code that reproduces the analysis and figures in this article is available exclusively to EdTribune subscribers.
Discussion
Sign in to join the discussion.
Loading comments...