Correction: The enrollment history and comparisons now use the complete original annual membership files. Several earlier totals and differences were incomplete. The earlier claim that future decline was inevitable has been removed.
Jefferson County R-1↗ET reported 74,177 students in 2025–2026, last school year and the most recent published membership count. Its original annual file for 2015–2016 reported 86,708. The difference is 12,531 students, or 14.5% of the earlier total.
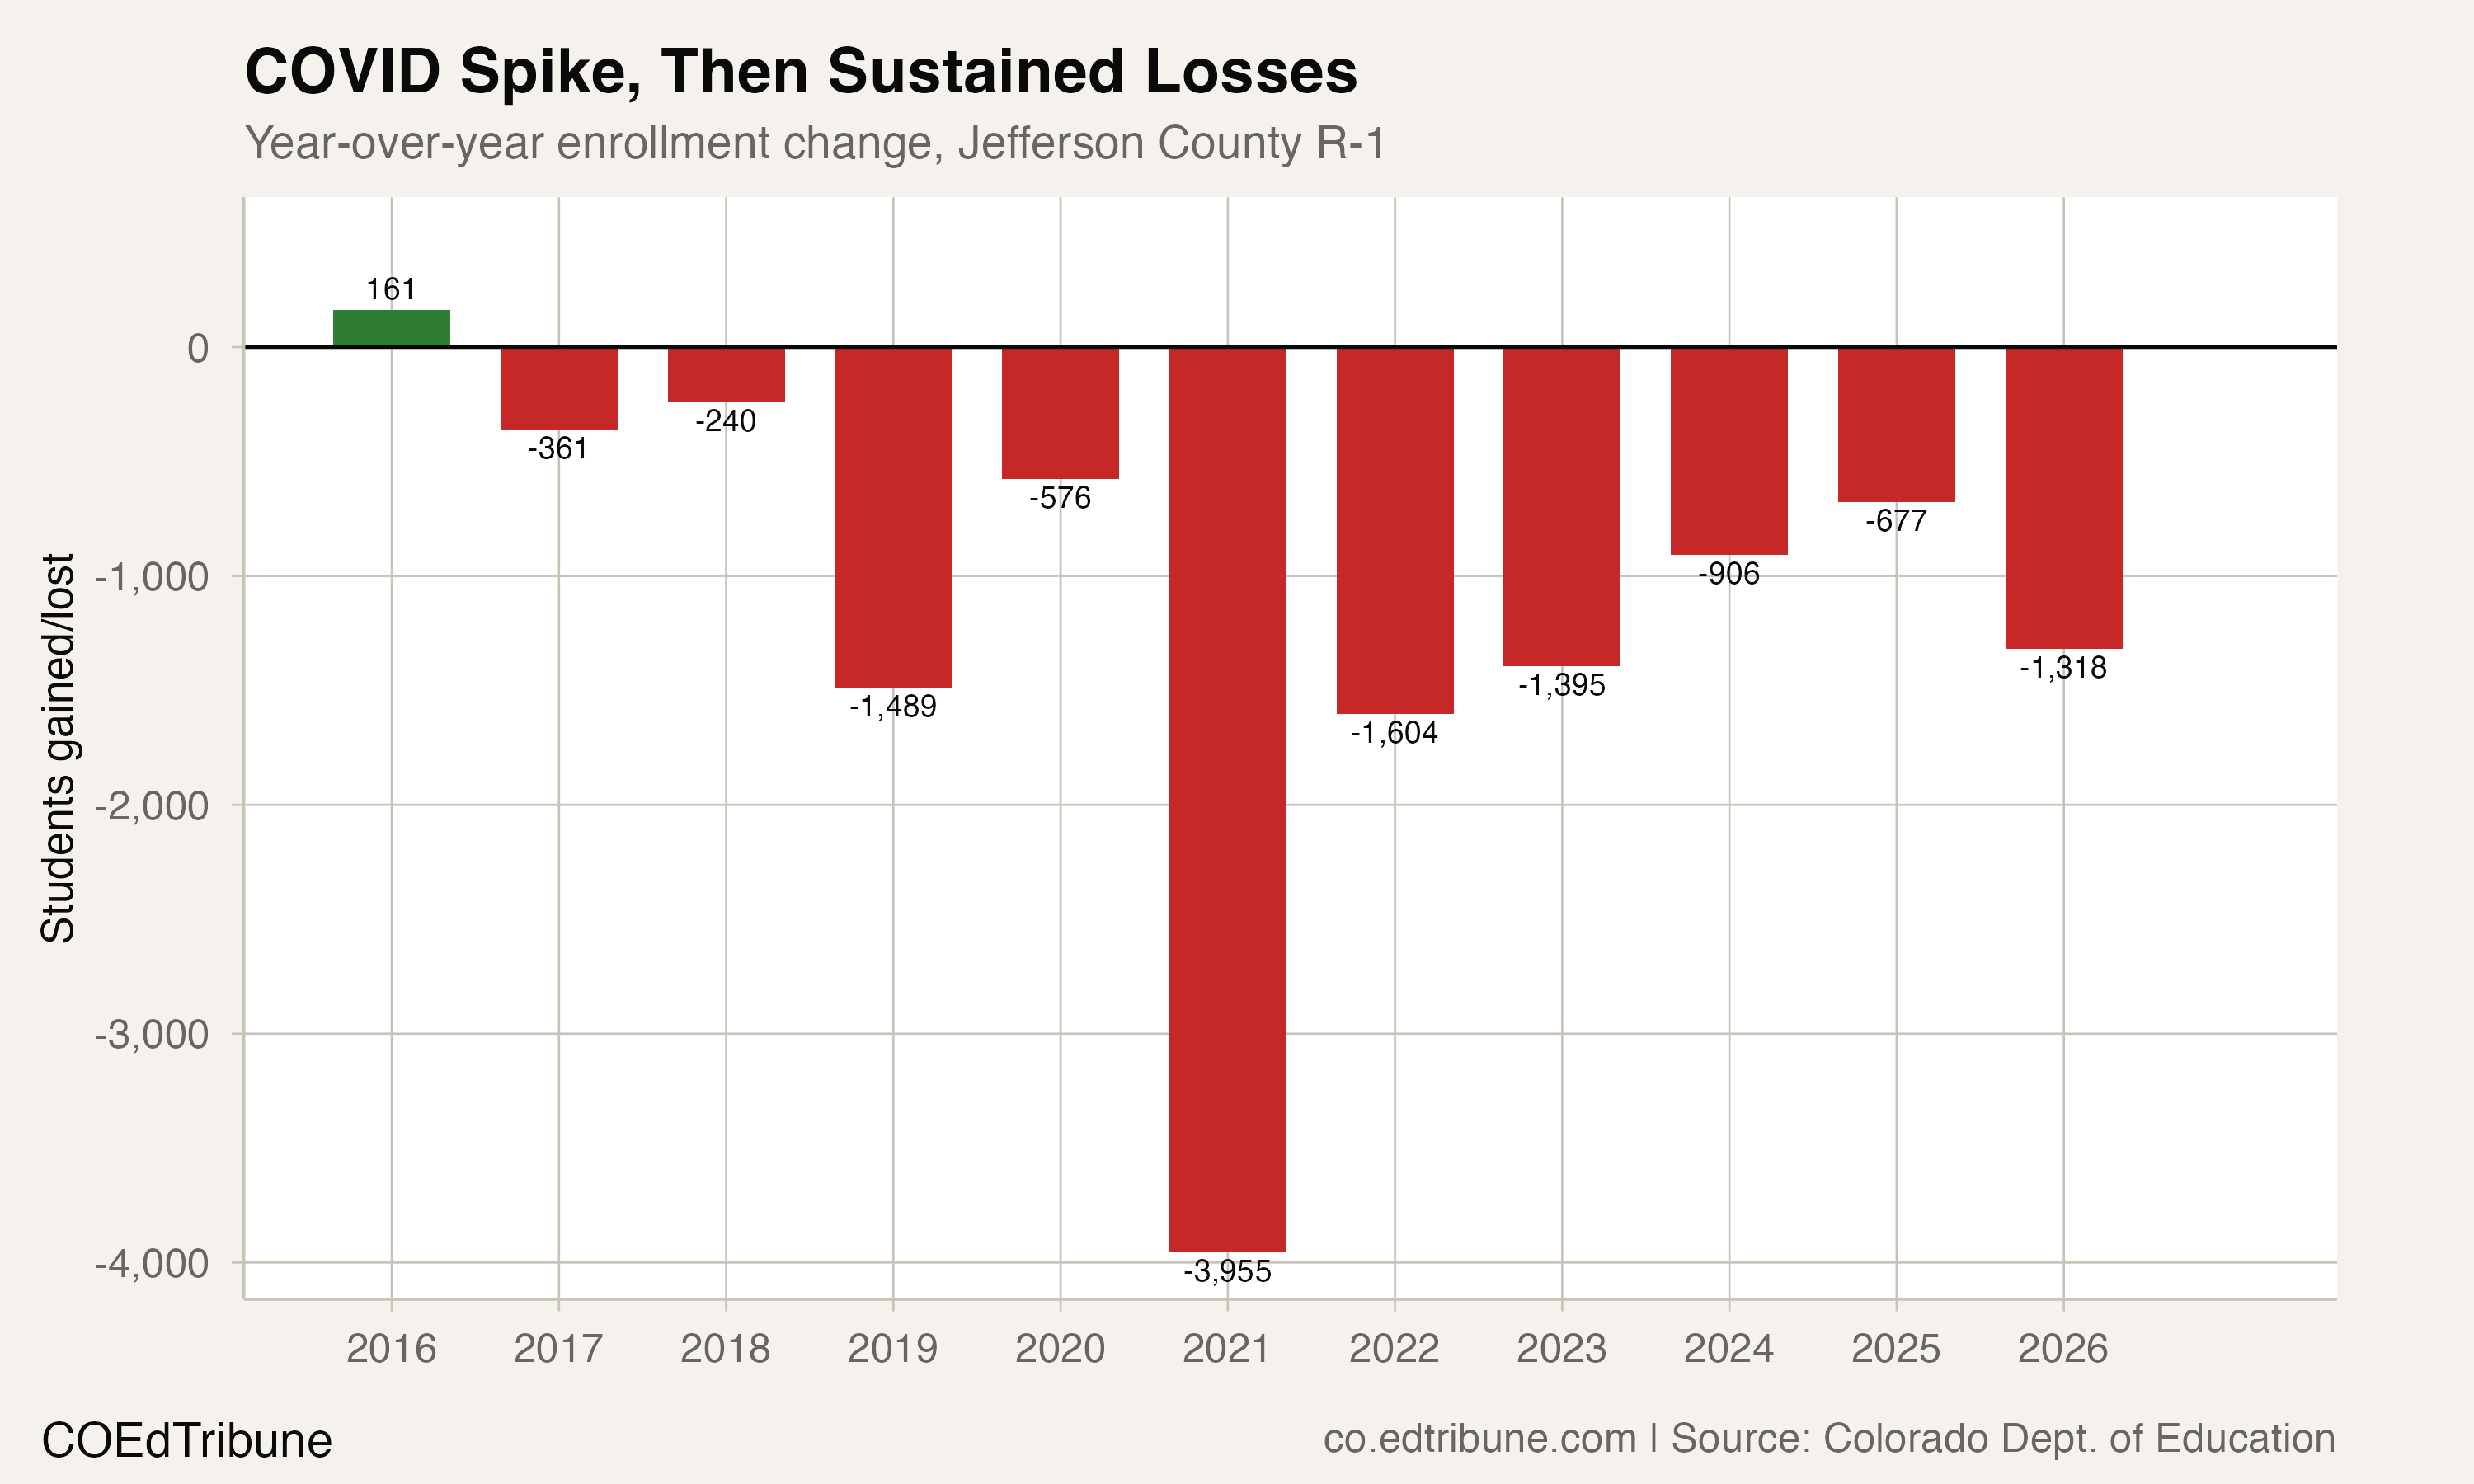
The loss accumulated through 10 consecutive annual declines after that earlier count. A district can lose students in an isolated year and recover in the next. This history shows something different: every adjacent annual comparison across the decade was negative, including the most recent loss of 1,318 students.
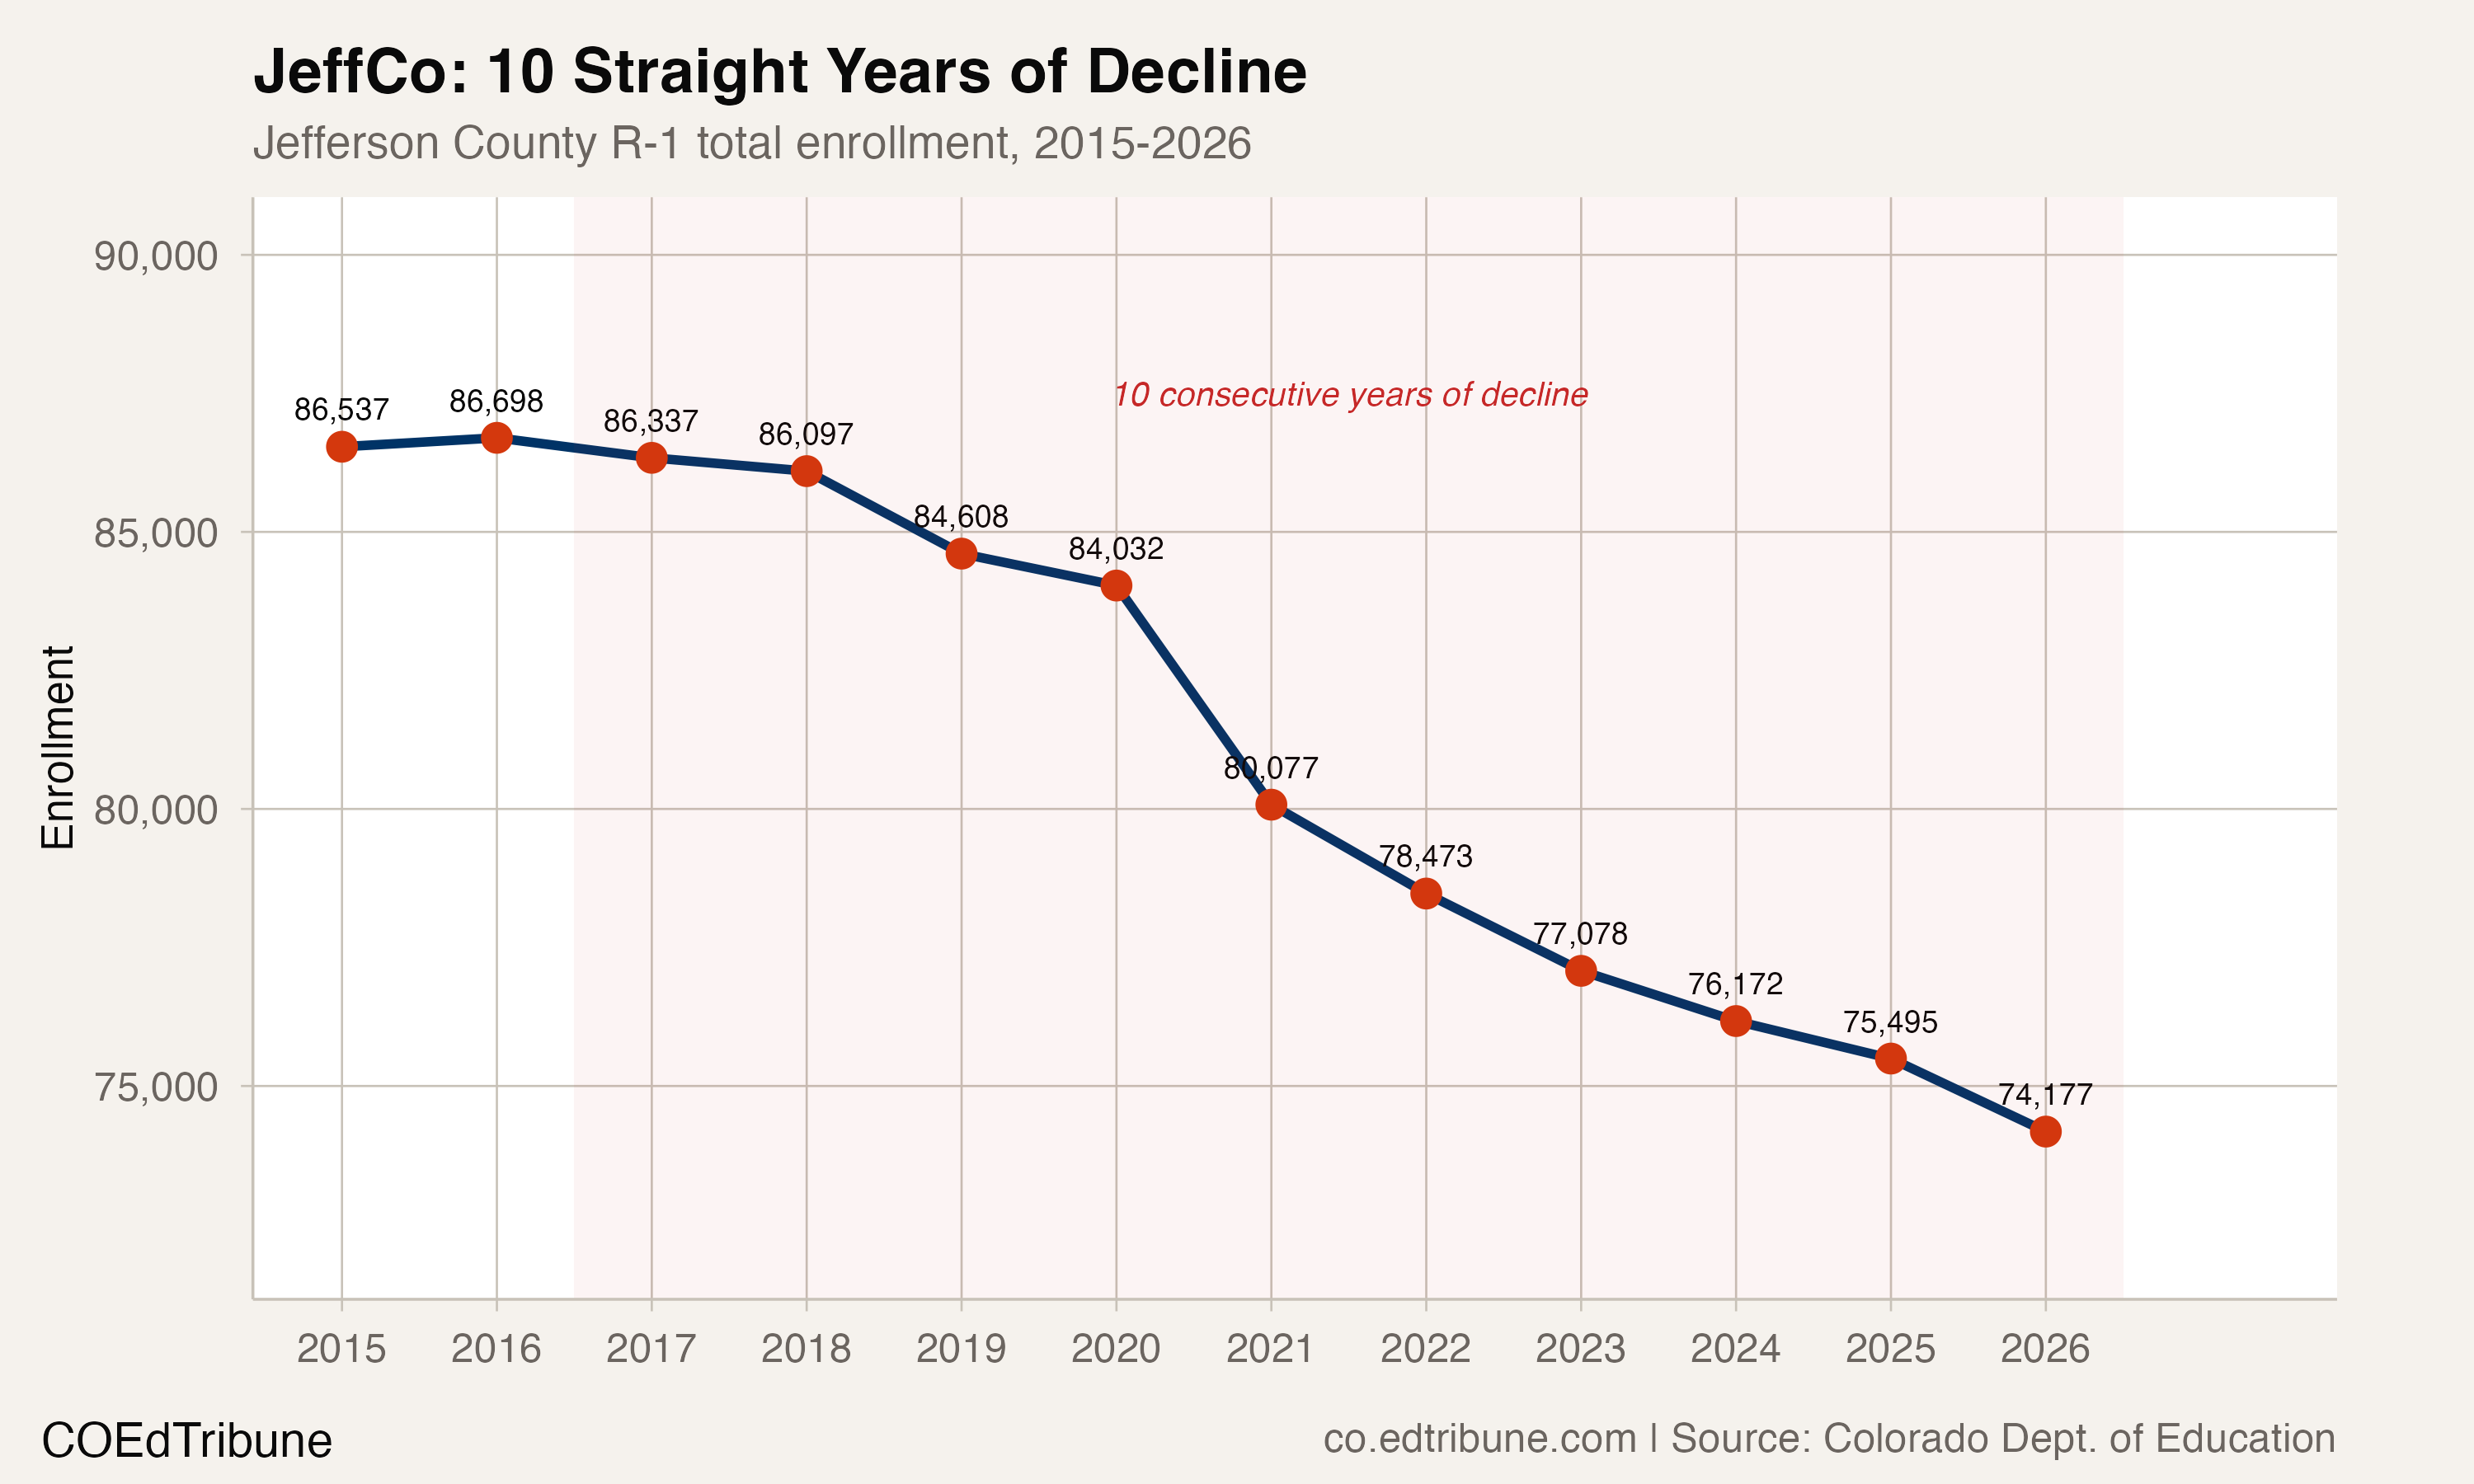
The streak survives the corrected totals
The largest annual loss in the available history was 3,960 students in the 2020–2021 comparison. The decline began before that pandemic-era transition and continued afterward. The size of that loss does not make the earlier or later changes disappear, nor does its timing establish the contribution of any particular cause.
The streak comparison uses reporting organizations with complete annual records in the examined period and more than 10,000 students in the most recent published year. There are 22 such organizations. JeffCo had the second-longest continuing decline streak in this defined group. Pueblo City 60↗ET, with 11 adjacent annual decreases, was the only organization with a longer streak.
This is a comparison of reported organization enrollment, not a reconstruction of geographic attendance areas. The population includes organizations of different kinds. Its size threshold is an editorial choice, and the historical comparison is limited to the available original annual files.
The records establish persistence without establishing permanence. A run of past declines is useful for testing whether a brief improvement elsewhere represents recovery. It cannot establish the next year’s count before that count has been reported.
A wider gap with Denver
Denver County 1↗ET reported 89,210 students last school year. The difference between Denver and JeffCo was 15,033, compared with 2,292 in 2014–2015. This compares the two named reporting organizations at the same annual endpoints.
JeffCo’s share of the published statewide total fell from 9.7% in 2014–2015 to 8.5% last school year. Both shares use the published Colorado total as the denominator. They do not treat only selected districts as the entire state.
In the article’s separately selected suburban comparison, 7 of 9 organizations had lower counts than in 2015–2016. That selection provides context, rather than a claim that all Colorado suburbs followed the same path. The named comparison includes Jefferson, Douglas, Cherry Creek, Adams-Arapahoe, Adams 12 Five Star Schools, St Vrain Valley, Boulder Valley, Poudre and Academy 20.
The difference between organizations matters for planning. A statewide decline does not tell a district which building has fewer students, which programs families use or where facilities remain crowded.
Smaller grade groups, without an inevitable forecast
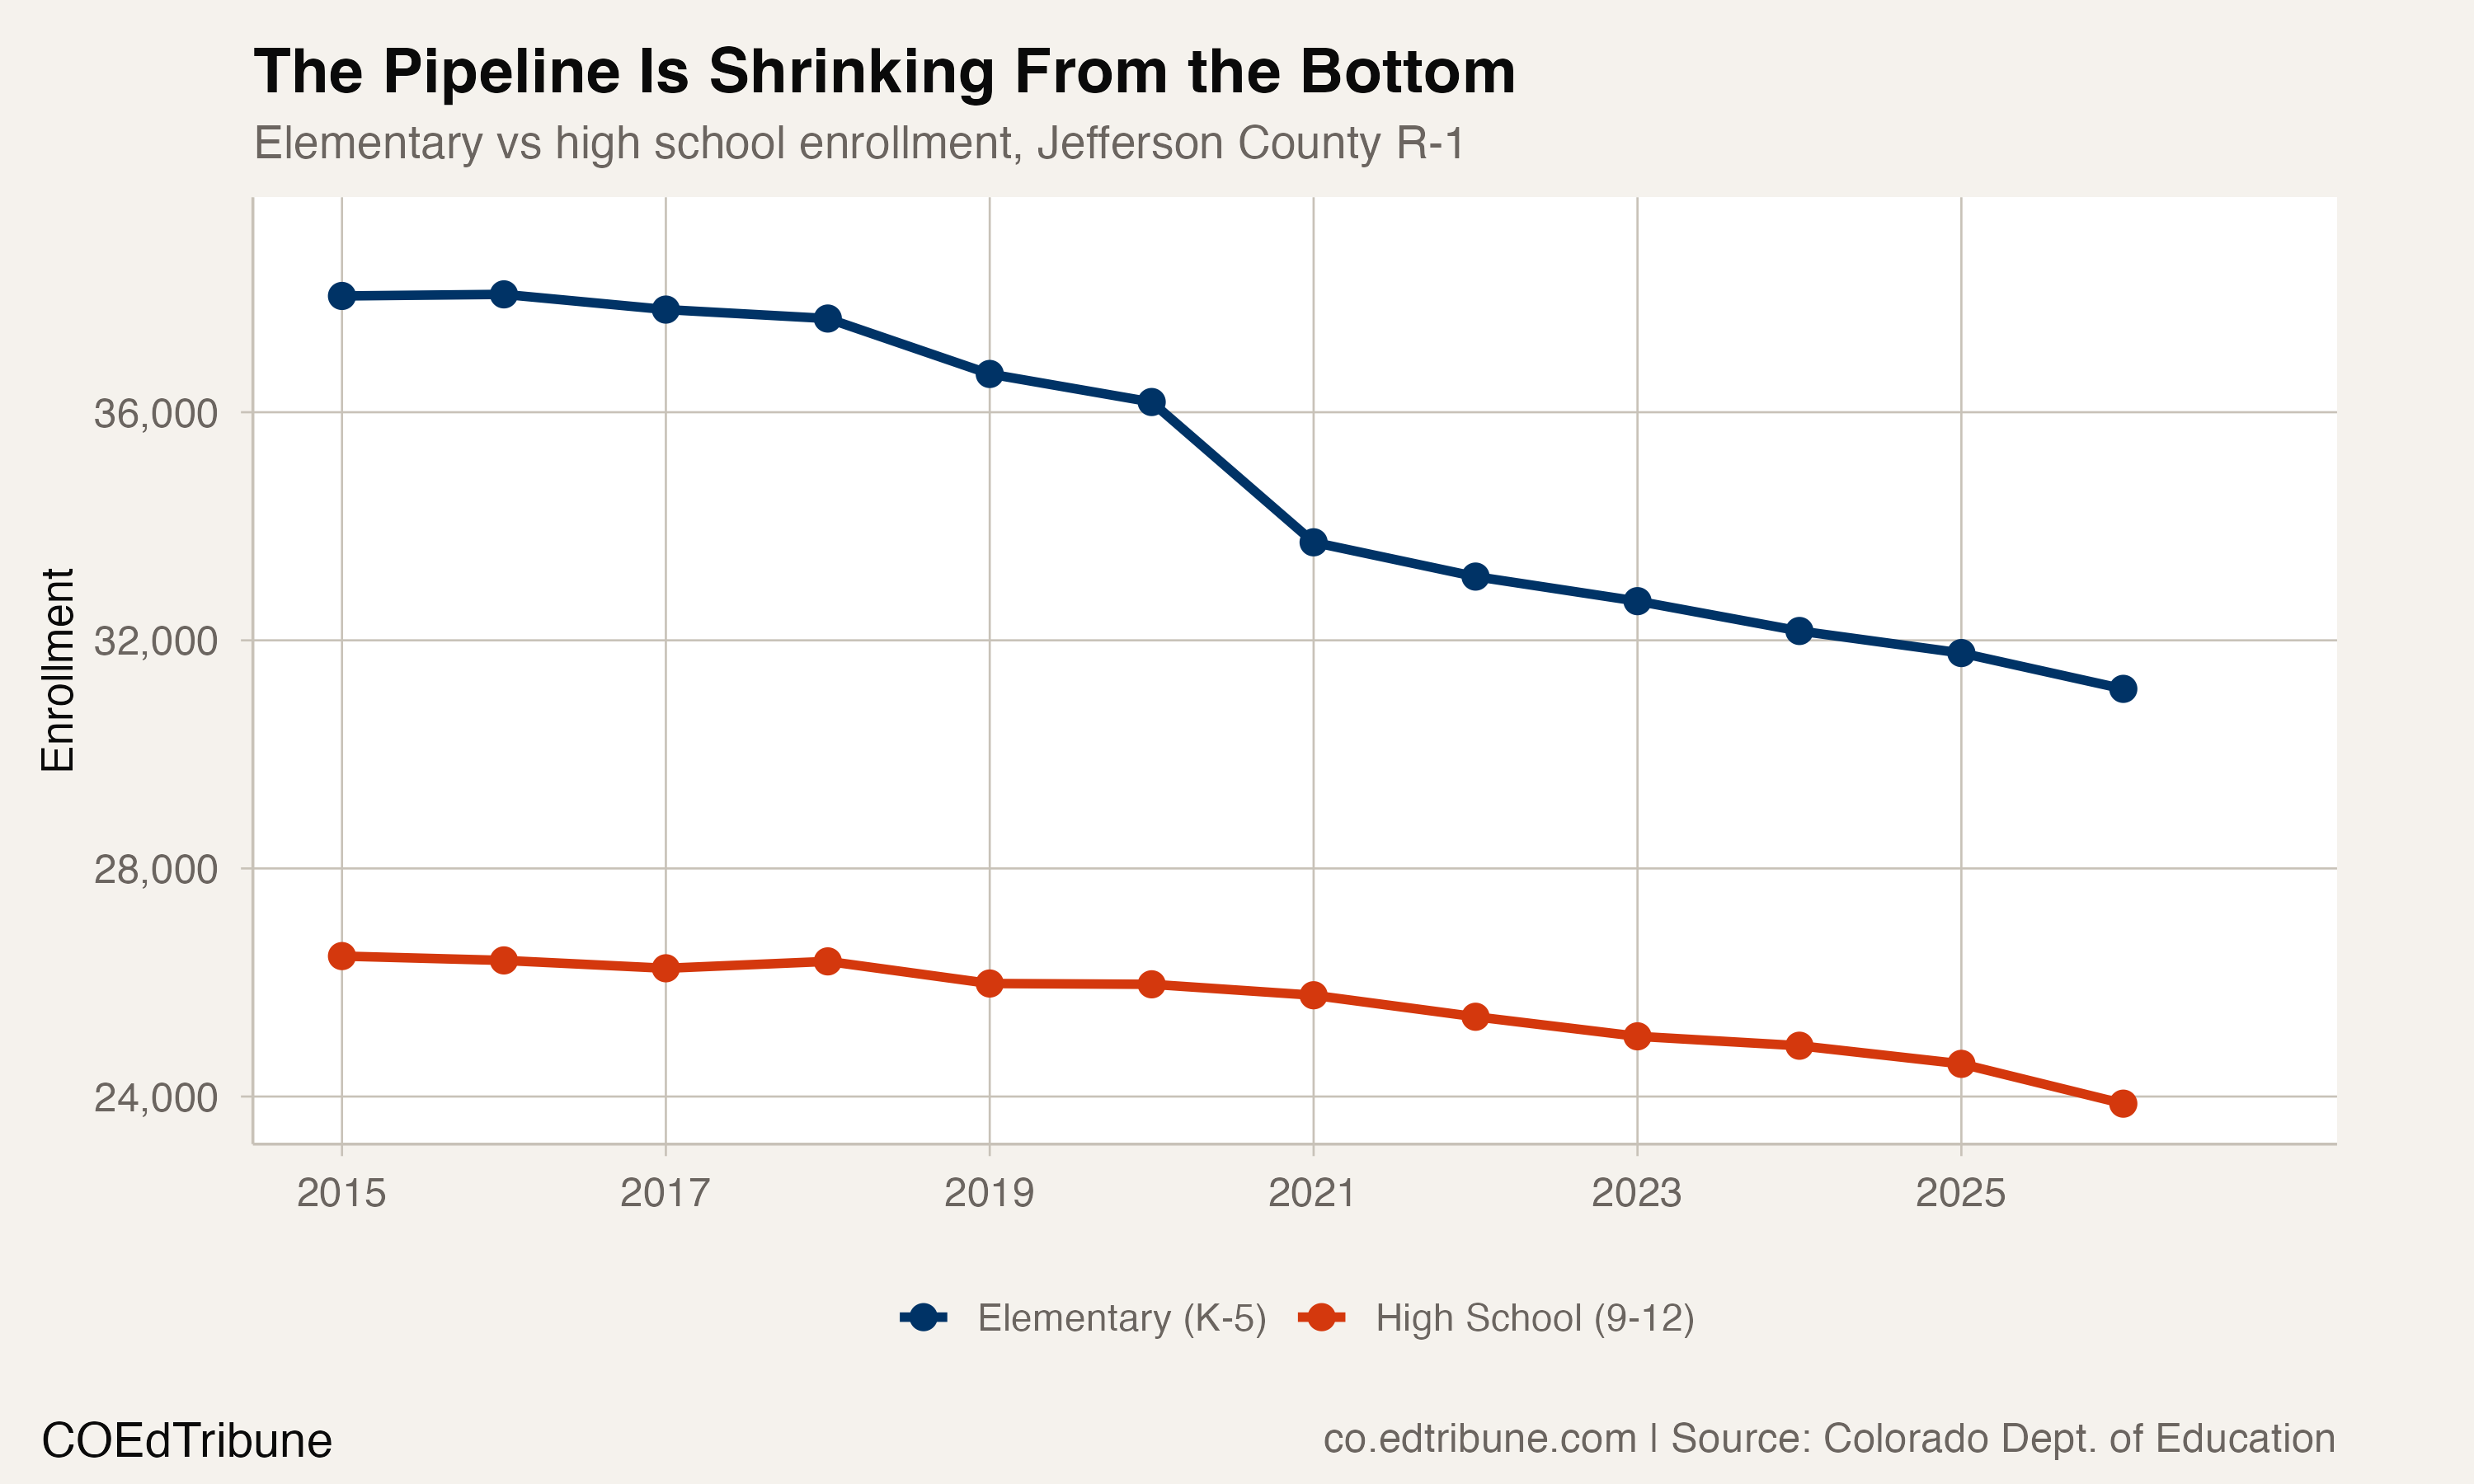
JeffCo’s combined kindergarten-through-fifth-grade count fell from 38,067 in 2015–2016 to 31,149 last school year. Its ninth-through-twelfth-grade count fell from 26,397 to 23,875 across the same endpoints. Each band includes every named grade, with no missing cell replaced by zero.
Kindergarten membership fell from 5,958 to 4,934 over the decade. Last school year’s twelfth-grade membership was 6,436. Those are enrollment counts, not counts of graduates or a tracked cohort moving from entry to exit.
The comparison gives planners a reason to examine incoming classes closely. It does not lock future enrollment in place: membership can change between grades, and these cross-sectional counts do not measure those movements. The earlier article’s assertion of unavoidable contraction extended beyond what the records could show.
Jeffco’s membership projection process considers birth trends, housing, development and school choice, and the district says its projection reports inform boundaries and facility needs. Those additional inputs belong in a forecast. The annual membership series presented here measures what has already been reported; it does not isolate those factors’ contributions to the observed losses.
The history uses original annual files from each reporting year. Later online summaries may revise earlier values, so they are not substituted into this series piecemeal. For JeffCo, the verified result is a long decline with a smaller reported student population. Choosing a response requires local evidence about buildings, services and families alongside that history.
Detailed code that reproduces the analysis and figures in this article is available exclusively to EdTribune subscribers.
Discussion
Sign in to join the discussion.
Loading comments...