Correction: This article has been revised to use original annual enrollment files, define the districts included, and distinguish losses from different individual peaks from a common starting-year comparison. Unsupported explanations and forecasts have been removed.
Six named Denver-area districts reported their lowest enrollment within the original annual files checked in 2025–2026, last school year and the most recent published data. They are Jefferson County R-1↗ET, Douglas County Re 1↗ET, Cherry Creek 5↗ET, Adams 12 Five Star Schools↗ET, Boulder Valley Re 2↗ET and Littleton 6↗ET.
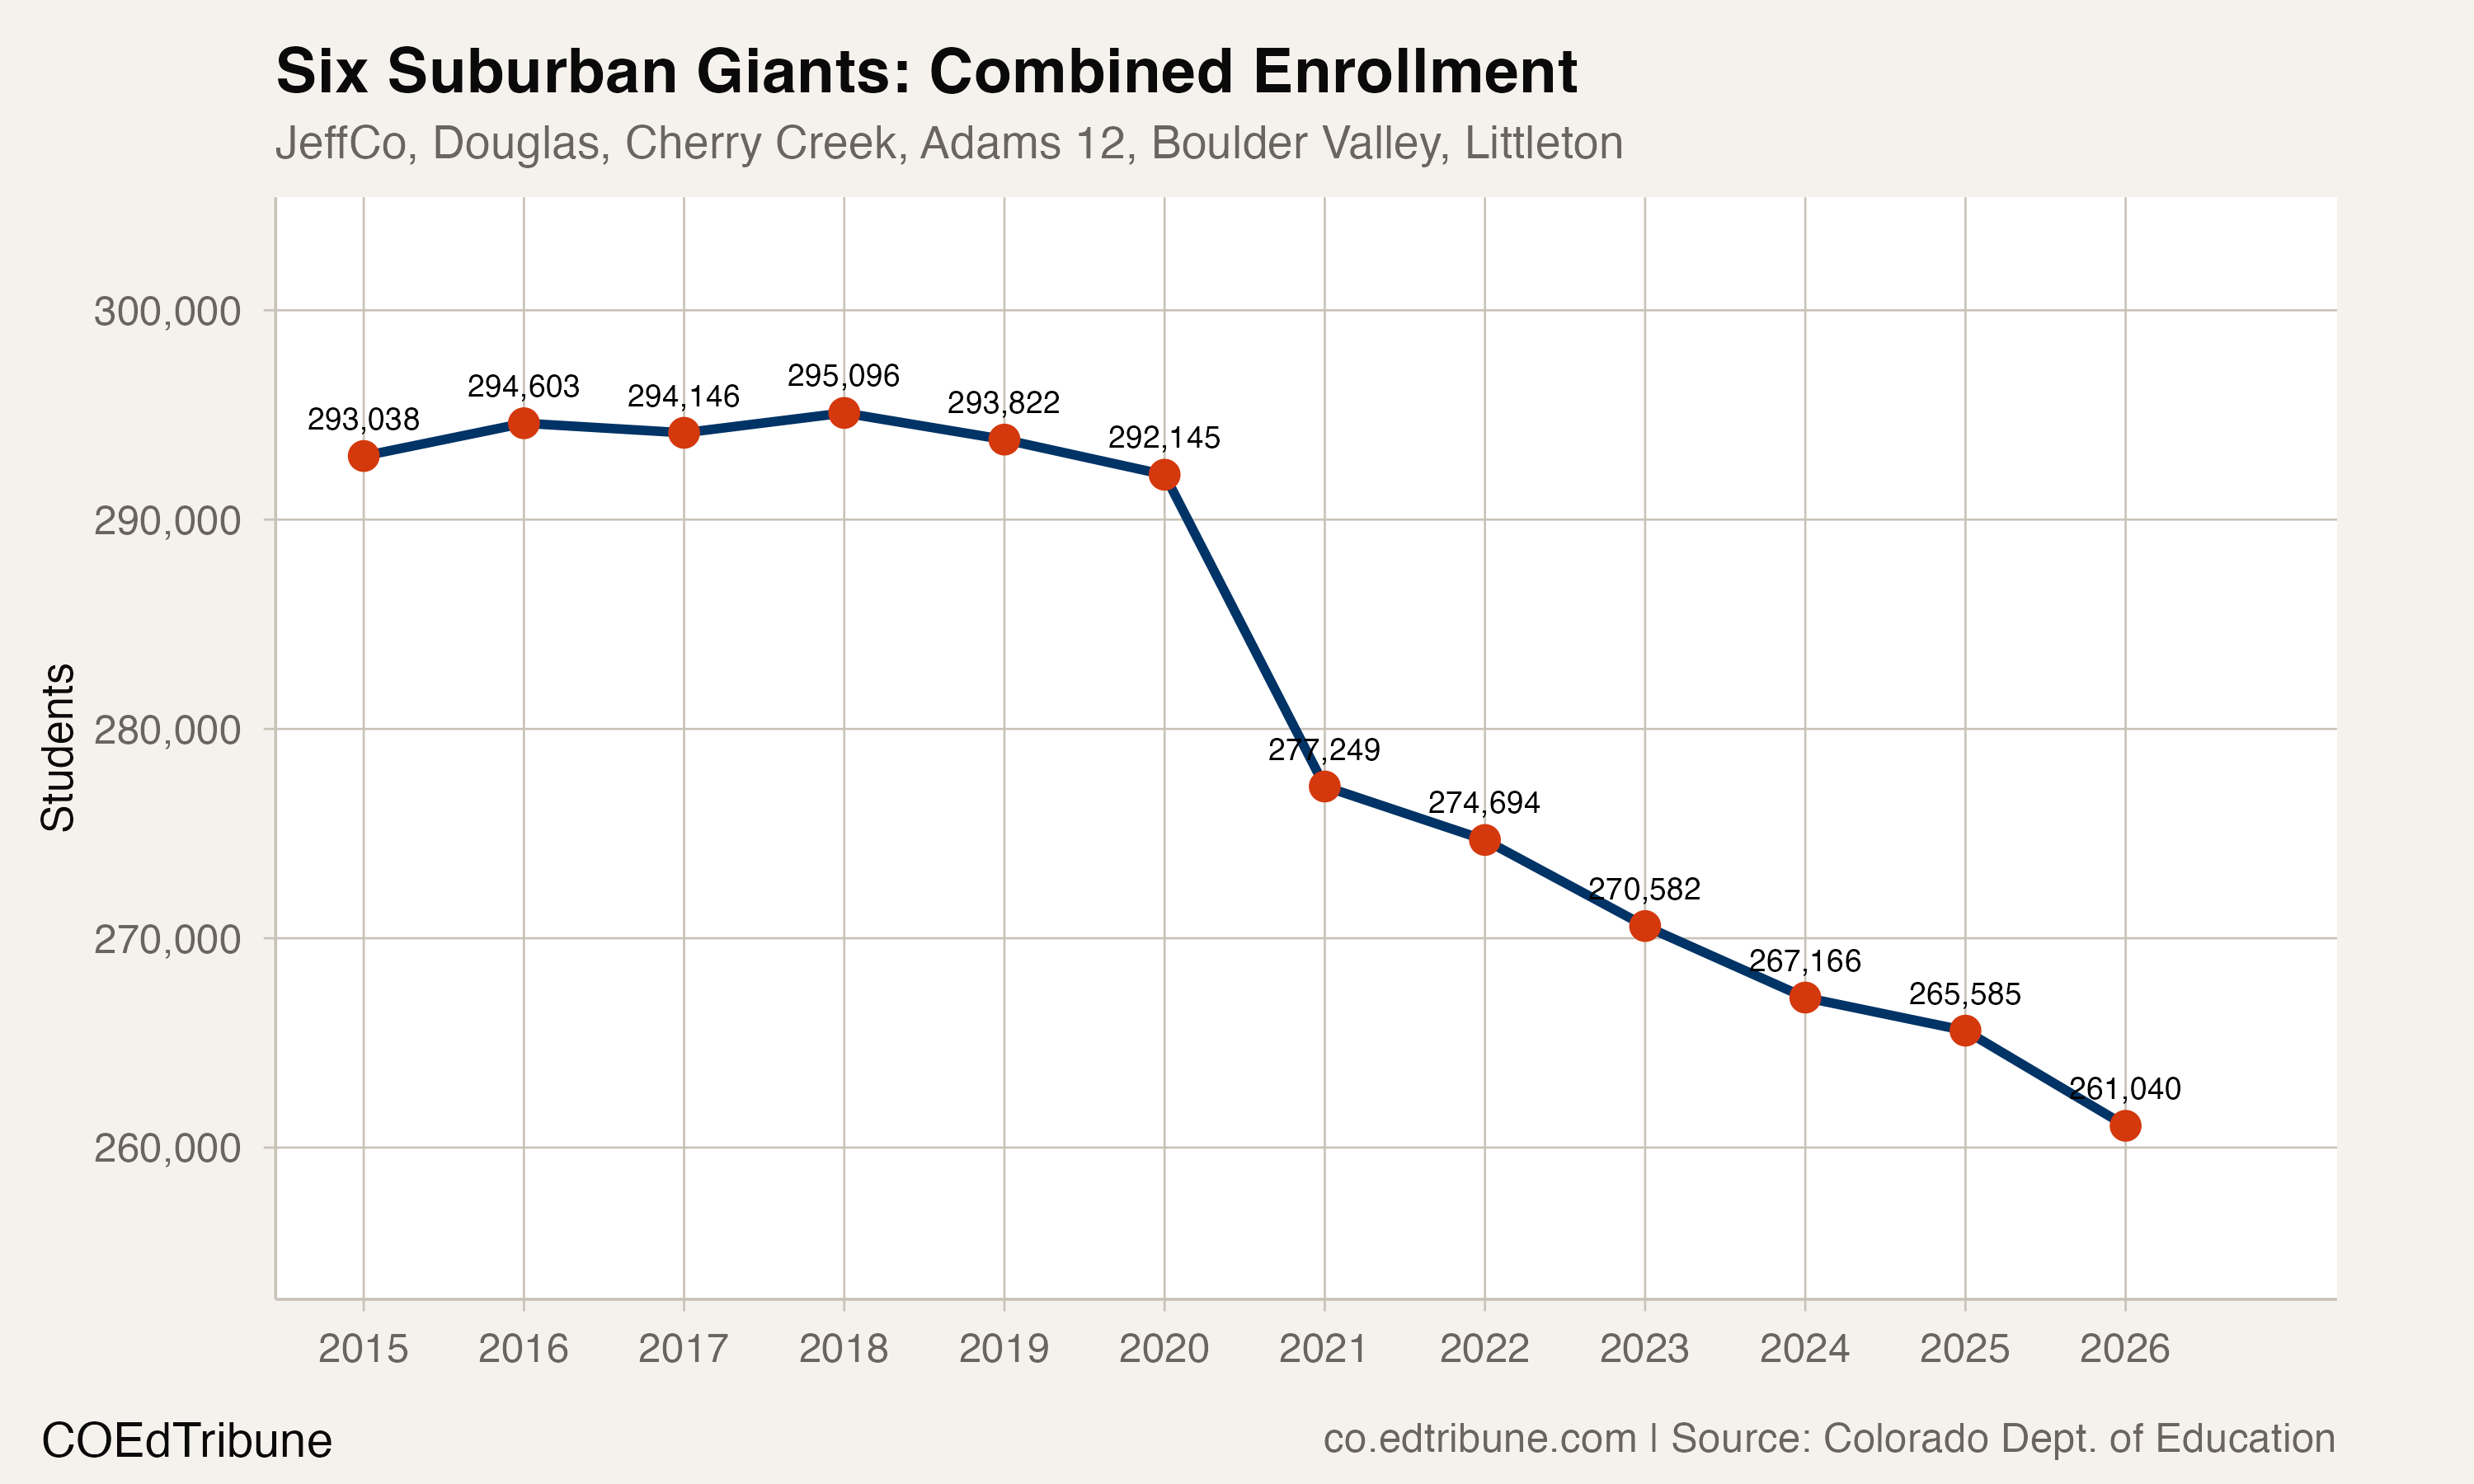
Together, they reported 261,040 students, or 30.0% of Colorado’s separately published statewide total of 870,793. Each district had a complete reporting history across the 12 annual files examined, beginning in 2014–2015. The latest count was a unique minimum for each within that period.
This is a comparison of the named districts. It does not establish that they are the six largest districts under a separately defined suburban geography, or that their latest counts are lower than every enrollment count before the checked period.
Different peaks, different loss measures
Adding each district’s loss from its own observed peak produces a total of 35,786 students. That calculation compares different starting years, because the districts did not all peak together. It should not be presented as a collective decline from a single year.
Using the same pre-pandemic baseline for all six gives a different answer. Their combined enrollment was 292,220 in 2019–2020 and 261,040 in the most recent year, a decline of 31,180 students. Over that same interval, the separately published statewide count fell by 42,430.
These measures answer different questions. A loss from each district’s peak describes the distance from its own observed high. A common-year comparison measures change over the same interval. Combining them would exaggerate or confuse the relationship to the statewide change.
The largest headcount loss and the largest percentage loss differ
Jefferson County had the largest loss from an observed peak among these districts. Its count fell from 86,708 in 2015–2016 to 74,177 in the most recent year, a loss of 12,531 students, or 14.5%. It recorded declines in 10 consecutive annual comparisons after that peak.
Littleton had the greatest proportional loss from its observed peak among the six. Its count declined from 15,780 to 12,904, a loss of 2,876 students, or 18.2%. Adams 12 Five Star Schools↗ET fell from 39,287 to 33,039, losing 6,248 students, or 15.9% of its peak.
Douglas County’s loss from its observed peak was 6,062 students; Cherry Creek’s was 4,328, and Boulder Valley’s was 3,741.
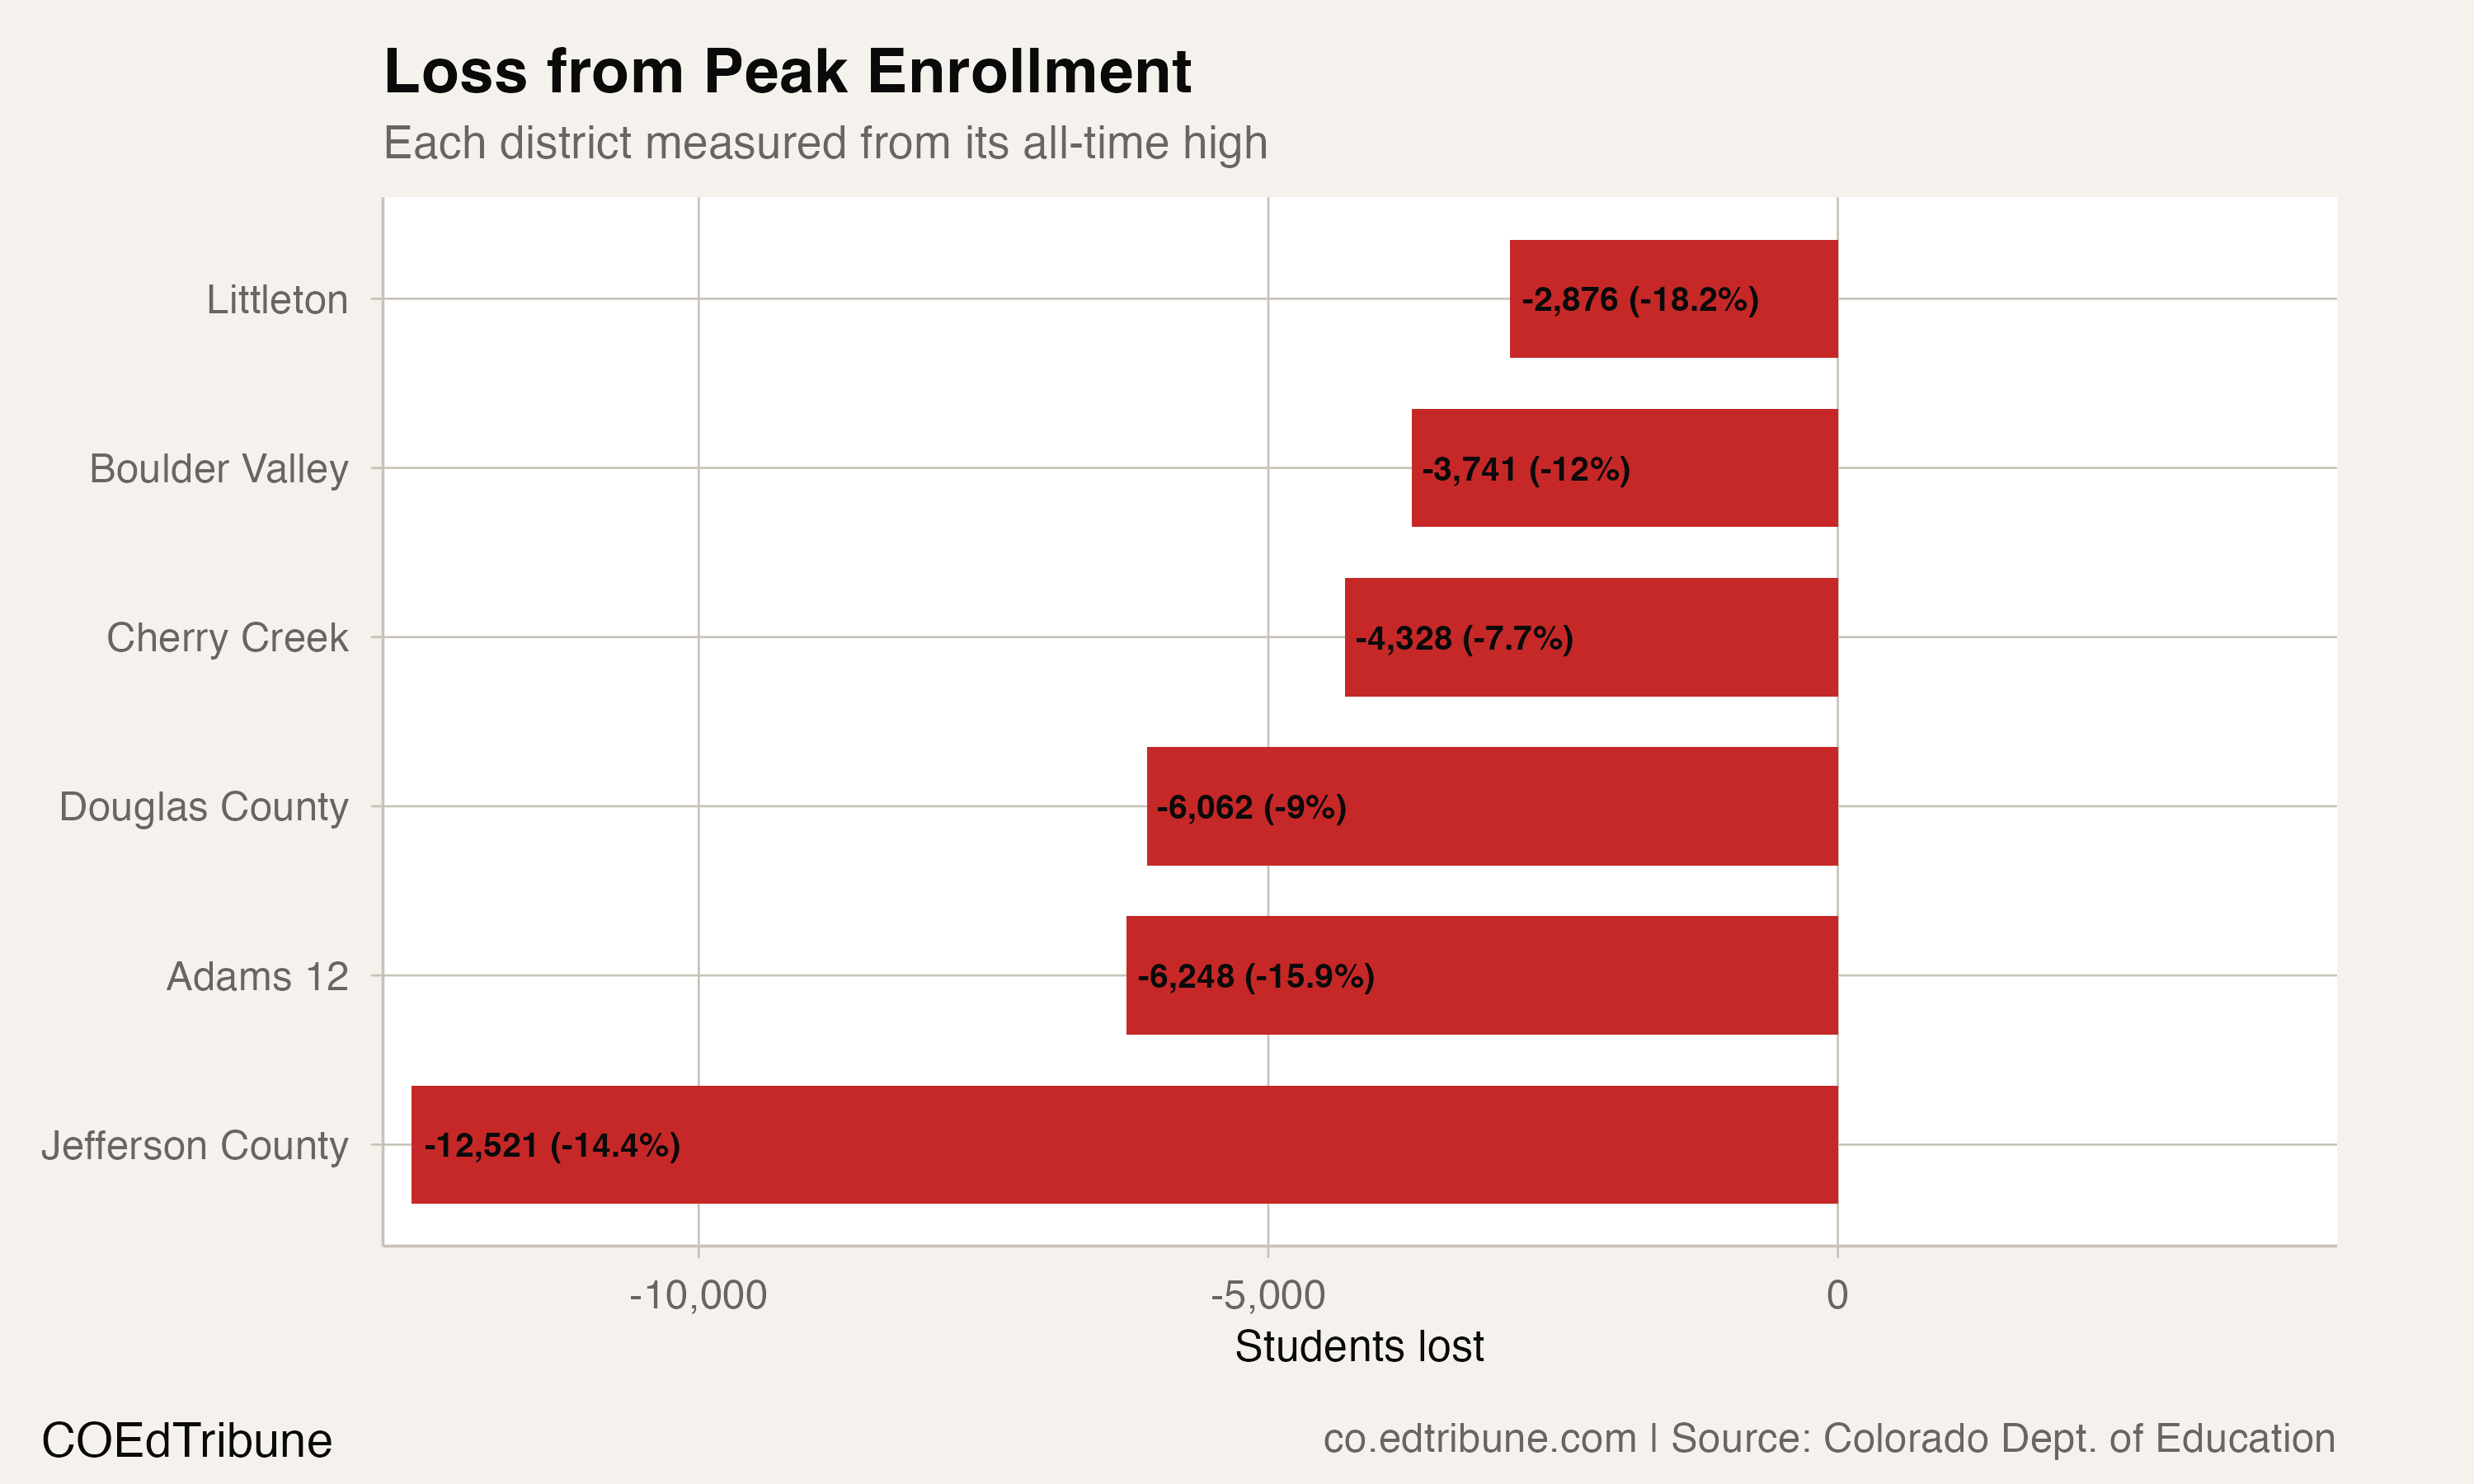
Those are measured enrollment changes. A larger headcount loss does not necessarily mean a larger proportional loss, and either measure needs its own stated starting point.
The most recent combined annual decline was larger
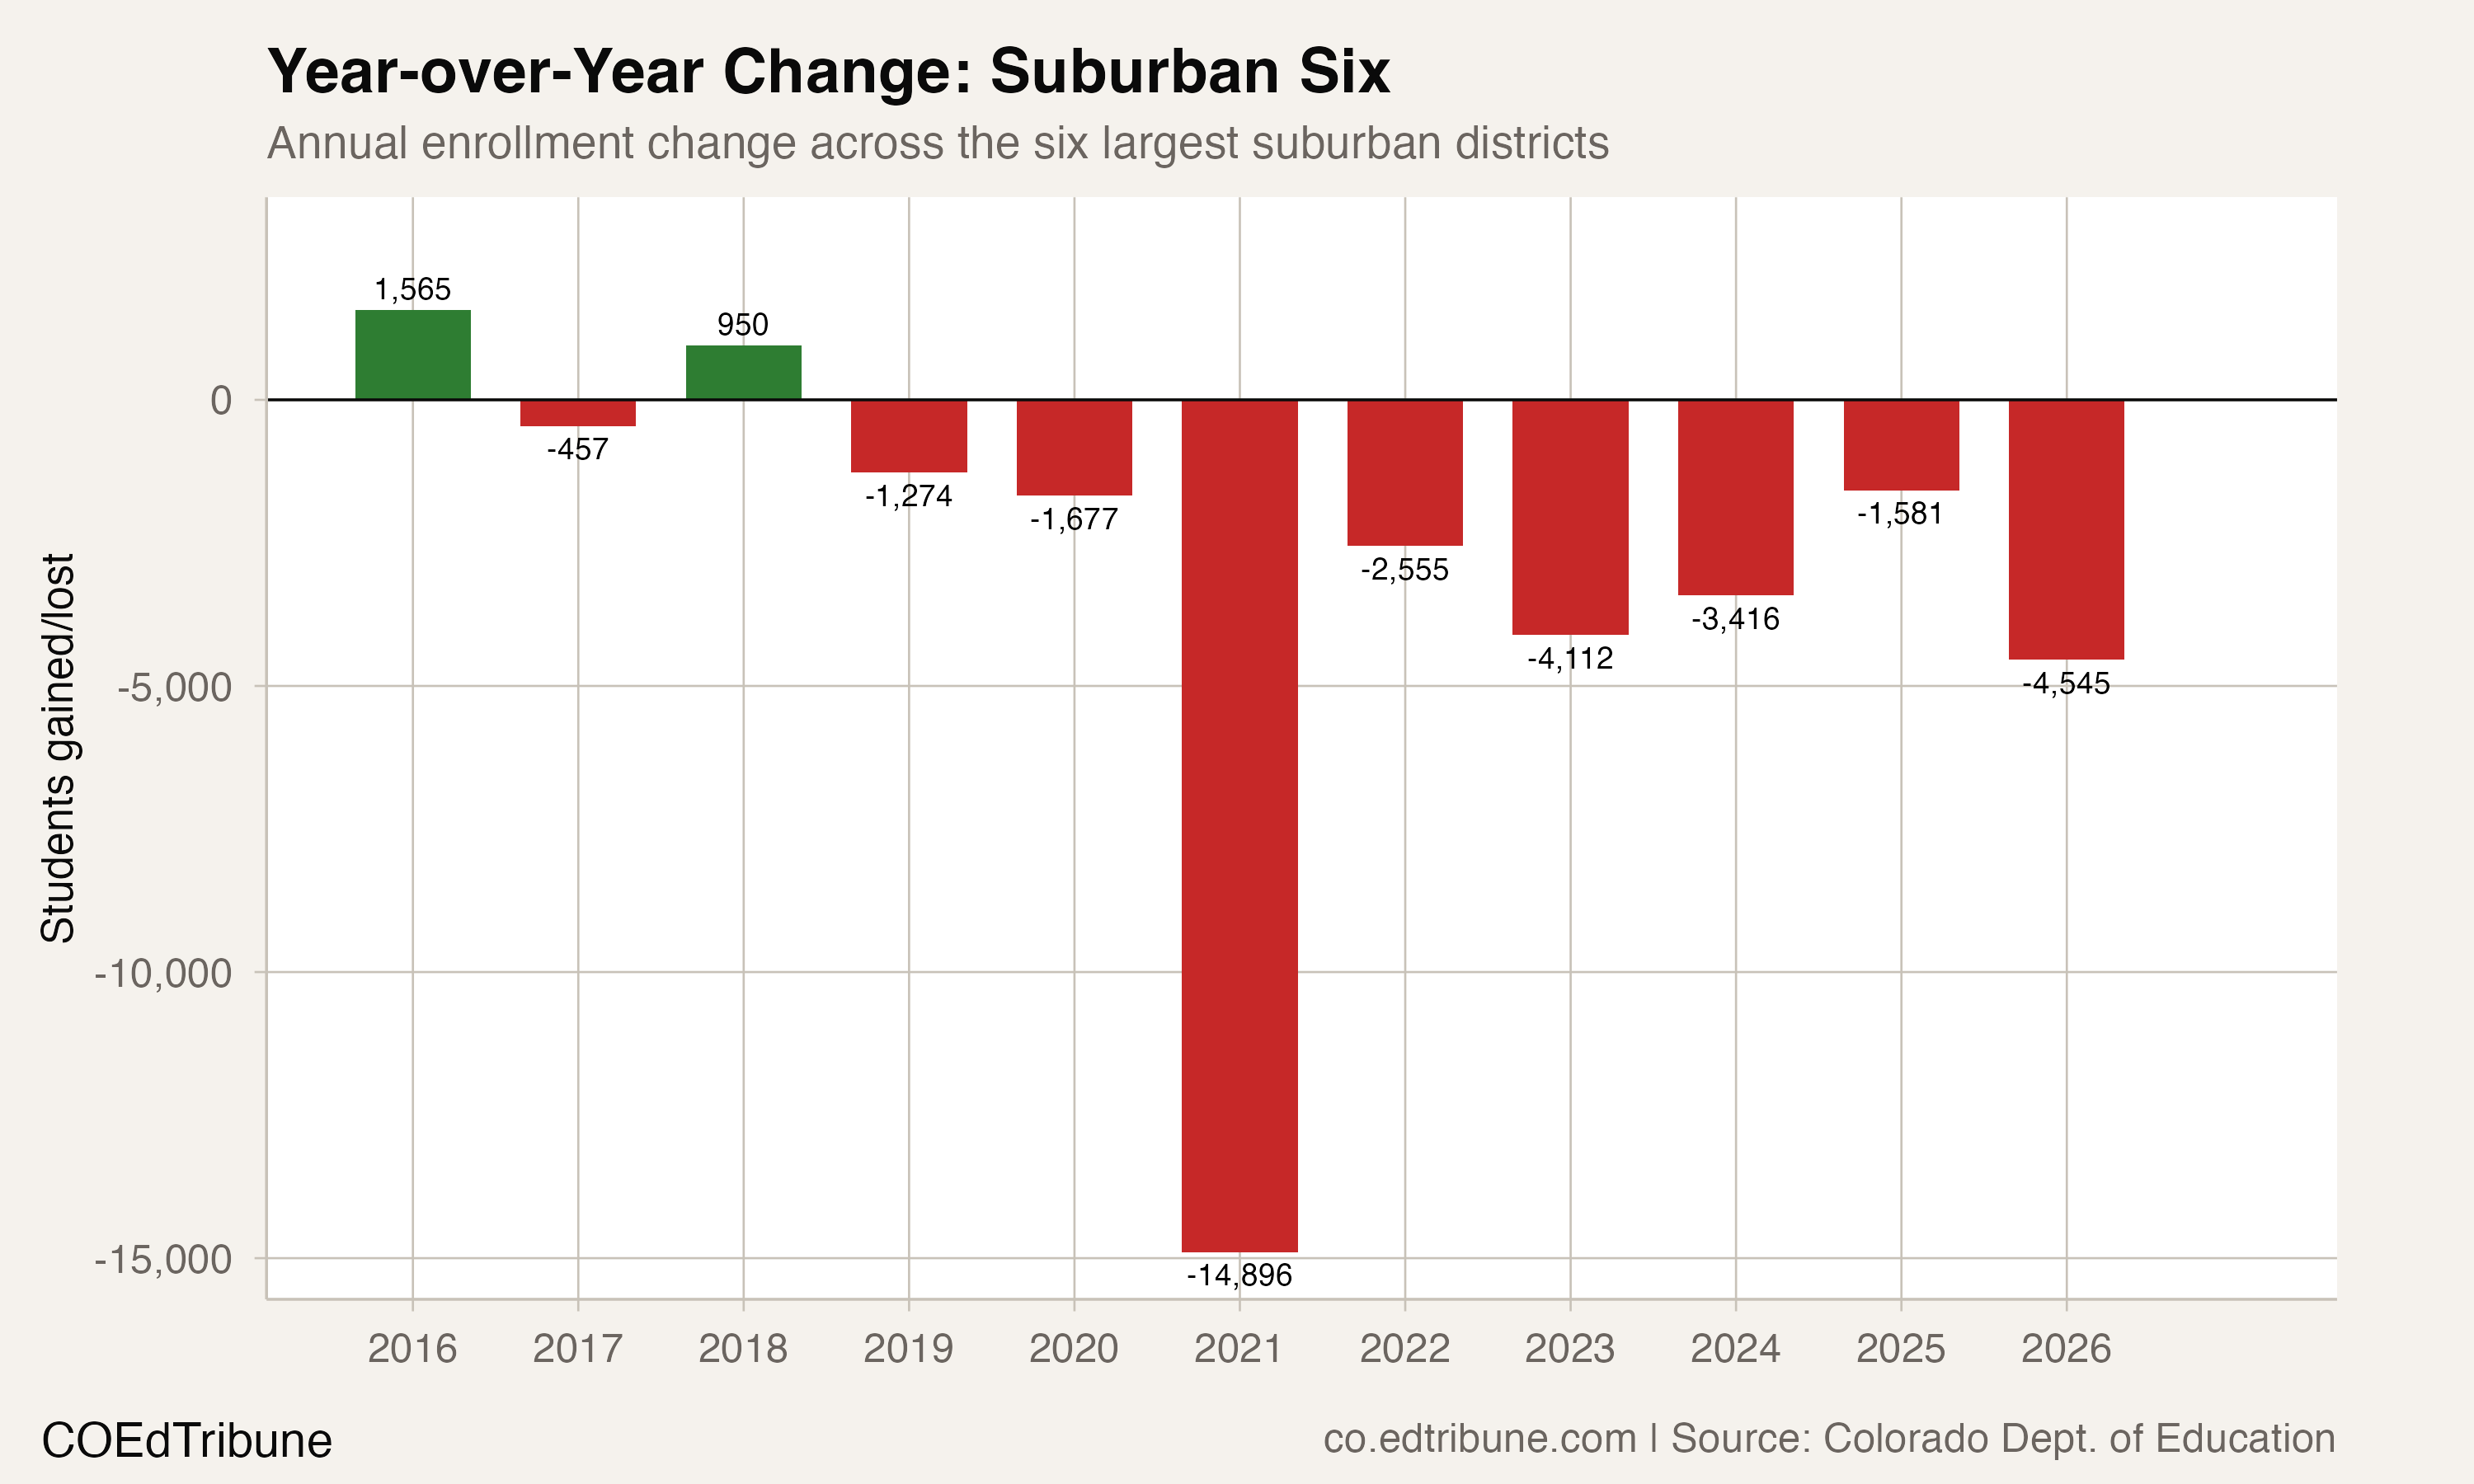
The first pandemic-era annual comparison brought a combined loss of 14,960 students across the six. Their combined enrollment continued to decline in every subsequent annual comparison in the checked period.
The most recent decline was 4,545 students, the largest annual loss after that initial pandemic-era drop. That is a comparison among observed years, rather than evidence that the next decline must be larger. It also does not mean every district had the same annual pattern.
Kindergarten counts describe membership, not its causes
Published kindergarten enrollment across the six districts fell from 20,400 in 2014–2015 to 16,728 in 2025–2026, a reduction of 3,672 students. All of the district-year counts used in that calculation are present; missing grade counts have not been filled with zero.
Those figures describe who was enrolled in kindergarten in each reporting year. They do not, by themselves, establish how many children were born locally, whether families moved, or whether children attended other schools. They also do not establish a future enrollment count simply by carrying an older cohort forward.
The Colorado Department of Education publishes membership covering preschool through high school and multiple kinds of reported organization. This comparison uses the named districts’ published totals and grade counts, with the published statewide total as the base for their student share.
The resulting finding is substantial but bounded: all six named districts were at lows within the checked annual history, and their combined enrollment had declined markedly from the same pre-pandemic baseline. The enrollment records do not identify how much of that change came from births, housing costs, migration, charter-school transfers or homeschooling, nor do they prescribe future budget or school-closure decisions.
Detailed code that reproduces the analysis and figures in this article is available exclusively to EdTribune subscribers.
Discussion
Sign in to join the discussion.
Loading comments...