Correction: This article has been revised to use the original annual enrollment files and to distinguish being below an earlier count from never having returned to it. The earlier projected enrollment gap and unsupported explanations have been removed.
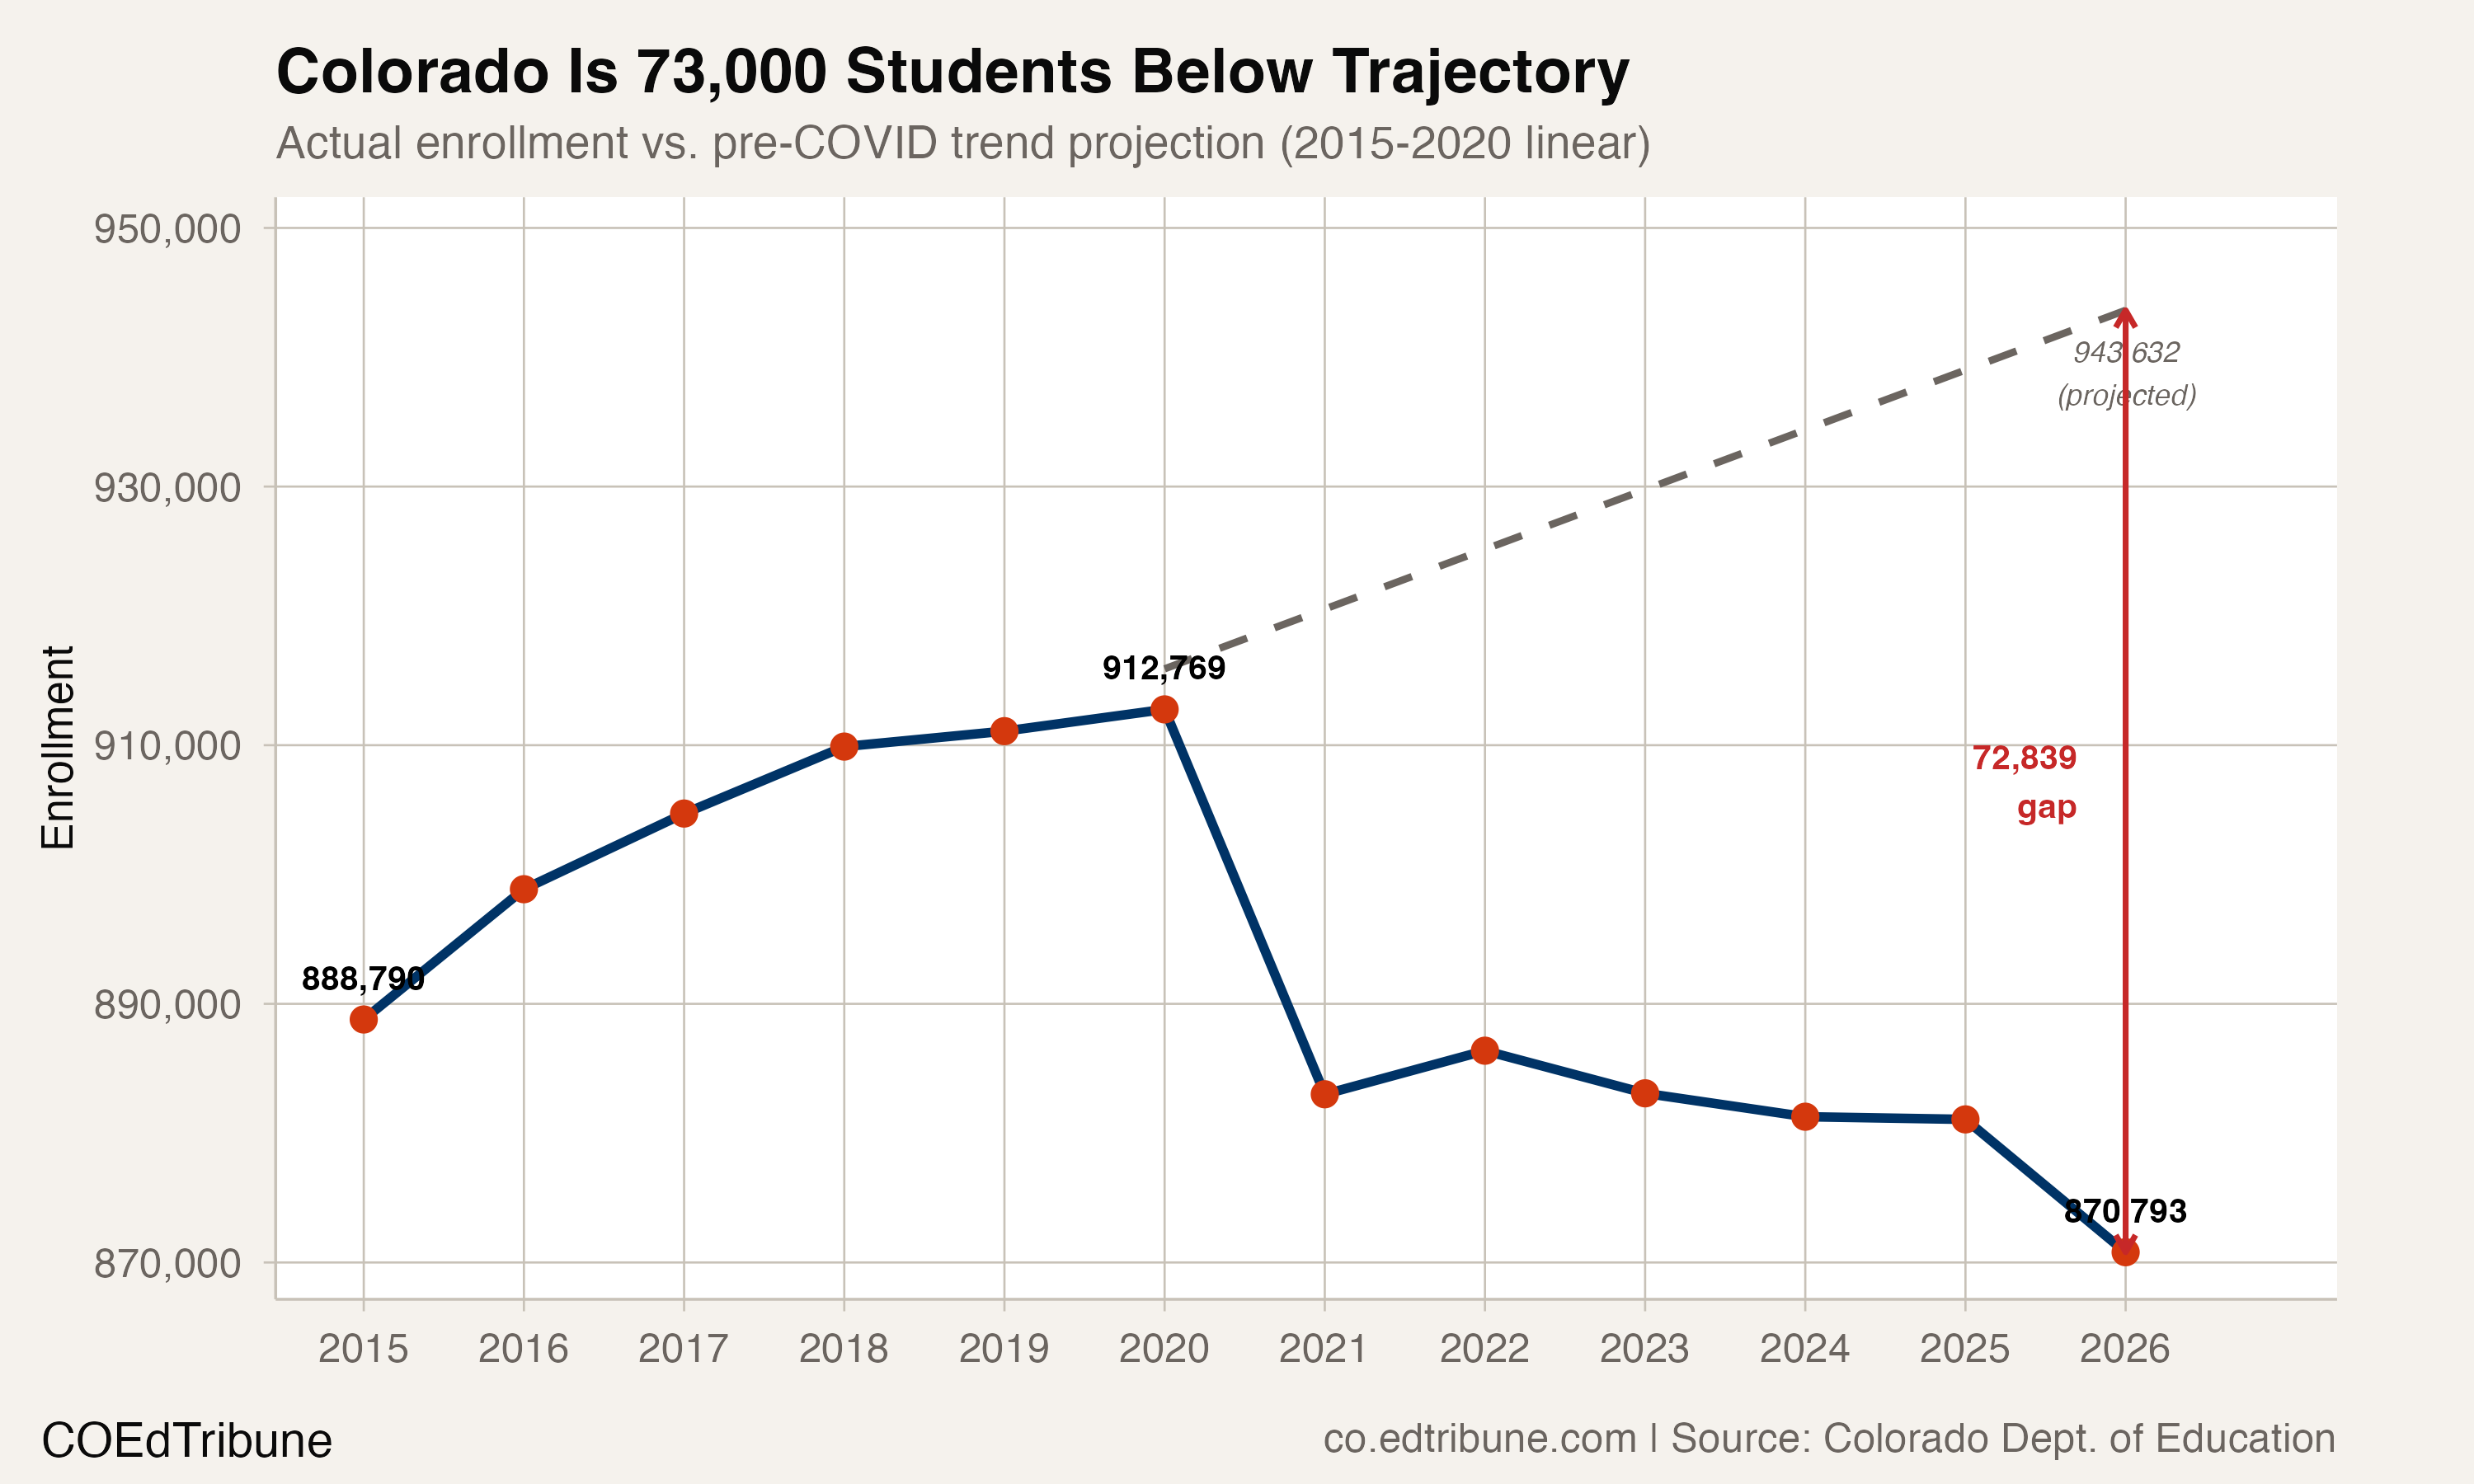
Colorado reported 870,793 public-school students in 2025–2026, last school year and the most recent published data. That was 42,430 fewer than the 913,223 reported in 2019–2020, before the pandemic disrupted schooling, a decline of 4.6%.
The statewide shortfall persisted despite a partial rebound. But the district-level question needs more care: a reporting organization can return to its earlier enrollment, then fall below it again. Calling every organization below its earlier count a system that “never recovered” erases that distinction.
A rebound followed by further losses
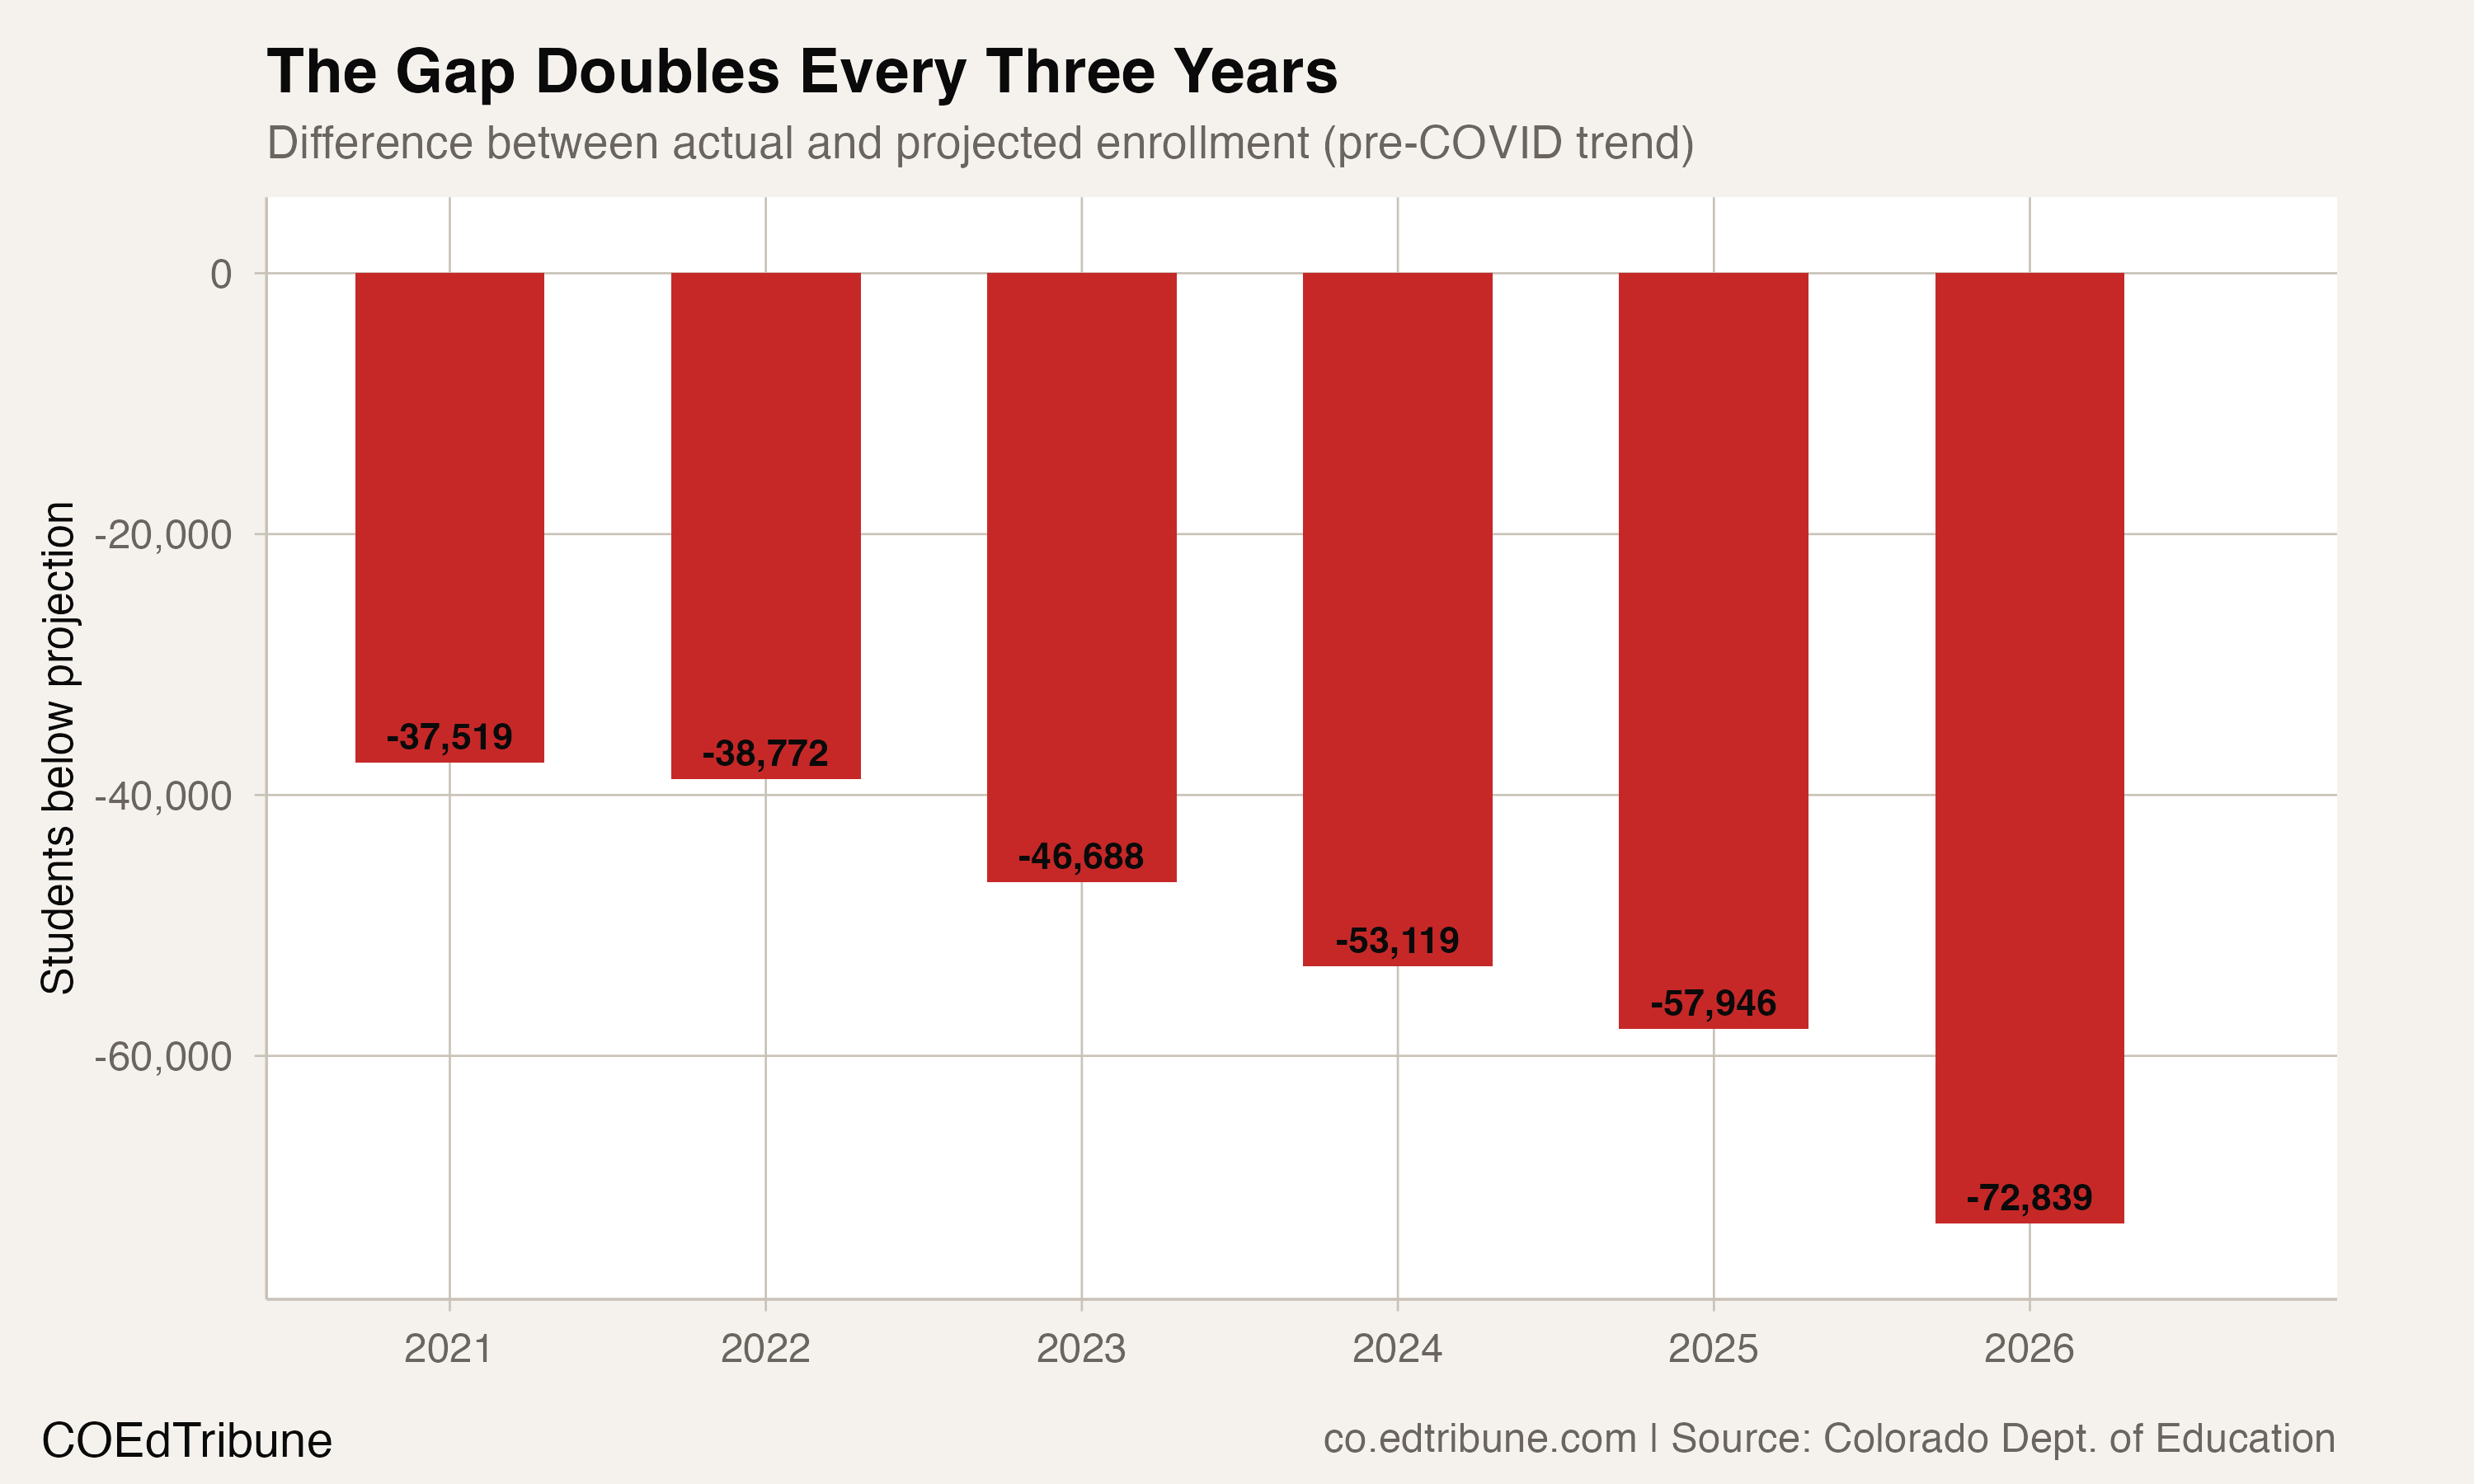
The original annual files recorded a loss of 30,024 students between 2019–2020 and 2020–2021. Enrollment then rose by 3,318 in 2021–2022. It declined in every subsequent annual comparison through the most recent published year, leaving enrollment 15,724 below that rebound-year count.
The final annual decline was 10,272 students. These are observed changes between published totals. They do not measure how many students Colorado would have enrolled if an earlier growth rate had continued. An extrapolated trend would require assumptions about an alternative future; it is not a count of missing students.
Below the baseline is not the same as never returning
The comparison follows 186 reporting organizations with the same identifiers throughout the period. Of those, 50 were at or above their 2019–2020 enrollment in 2025–2026; 136 were below it.
This population includes geographic school districts alongside other reported organizations. The Colorado Department of Education describes a membership collection that includes BOCES, detention centers and alternative schools, as well as preschool through high school. The counts should not be read as a comparison exclusively among local geographic districts.
A narrower test begins with the 144 organizations whose enrollment actually fell in the first pandemic-era annual comparison. Among those, 93 did not reach their earlier count in any subsequent observed year. Another 28 reached it at least once and then fell below it again. The remaining 23 were at or above that baseline in the most recent published year.
Those categories answer different questions. An organization that returned and later declined has a different enrollment history from one that stayed below its starting count throughout. Neither pattern, on its own, identifies why students left or where they enrolled instead.
Large districts still below their earlier counts
Among the 14 reporting organizations with at least 20,000 students in 2019–2020, only two were at or above that enrollment in the most recent year. District 49↗ET had gained 2,533 students over the full interval, while Greeley 6↗ET had gained 311.
That is an endpoint comparison, rather than a claim that both districts first lost enrollment and then recovered. The initial-loss test and the size test have different qualifying conditions.
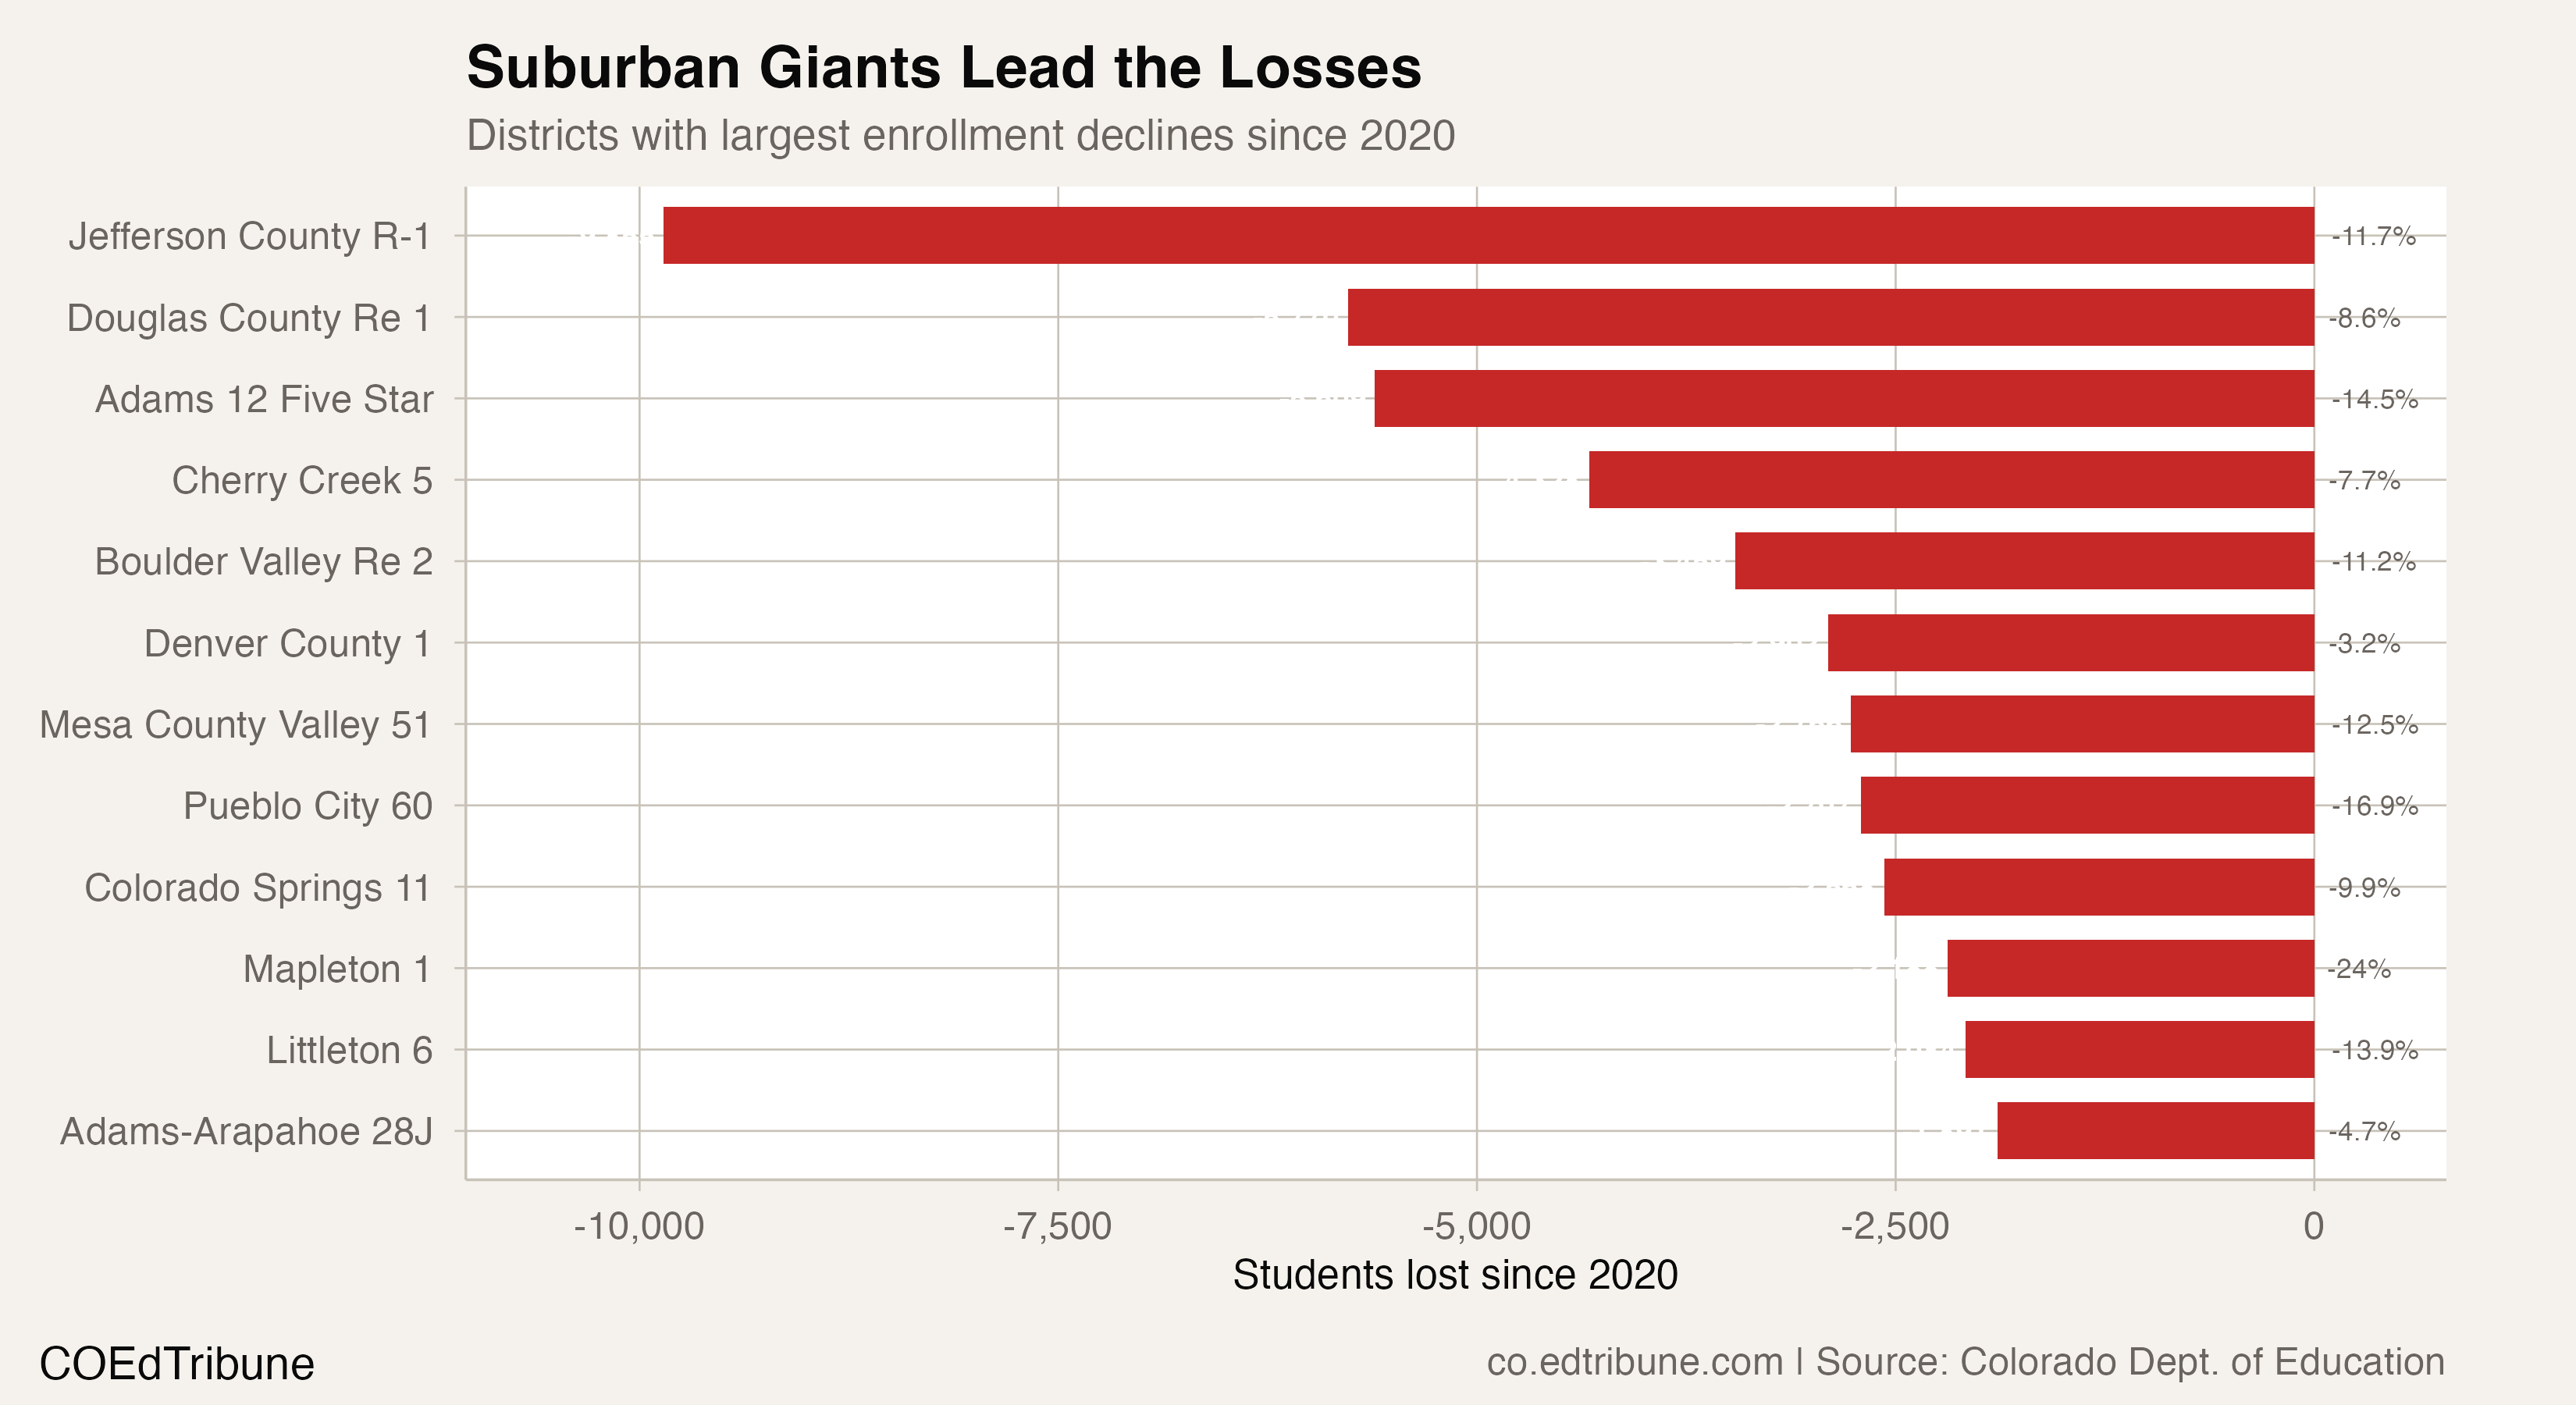
Jefferson County R-1↗ET reported 9,871 fewer students than at the pre-pandemic baseline. Douglas County Re 1↗ET was down 5,770, and Adams 12 Five Star Schools↗ET was down 5,668.
Growth also varied substantially across organizations. Education reEnvisioned BOCES↗ET gained 10,666 students over the interval, Byers 32J↗ET gained 5,246, and School District 27J↗ET gained 5,042. Those are organization totals. They are not a measured statewide online-school total or a basis for subtracting an invented “traditional” school population.
Across the full matched organization population, gains totaled 31,066 students and losses totaled 73,496. Their difference matches the separately published statewide decline. That reconciliation retains all reporting organizations rather than silently excluding unusual institutional types.
The baseline matters
Choosing an earlier starting year changes who qualifies as being back at baseline. Against 2018–2019, 56 reporting organizations were at or above their earlier enrollment in the most recent year. Against 2019–2020, the count was 50. “Recovered” therefore needs a stated starting year and a stated test.
This comparison consistently uses the original files for each reporting year. Later revisions on a current state webpage are not mixed into that history. Enrollment files describe membership; they do not by themselves establish the roles of births, housing costs, migration, school choice or particular funding decisions. Nor do they establish that a closure or further enrollment decline must follow.
The observed result is narrower and useful: statewide enrollment remained below its pre-pandemic count, most reporting organizations remained below theirs, and a meaningful group had regained its earlier count before declining again.
Detailed code that reproduces the analysis and figures in this article is available exclusively to EdTribune subscribers.
Discussion
Sign in to join the discussion.
Loading comments...