Correction (October 8, 2026): Original annual files give a different starting count and several different annual and district changes from those previously reported. This article now uses matching endpoints and published totals. Explanations based on births, category switching and tribal-school enrollment, an unverified quotation and a forecast have been withdrawn.
Colorado reported 4,974 Native American students in 2025–2026, last school year's membership and the most recent published data. That was down from 6,424 in 2015–2016, a loss of 1,450 students, or 22.6%. Among the state's seven published racial categories, Native American membership had the steepest percentage decline over those endpoints.
The state's overall membership declined by 3.1% over the same window. Native American students represented 0.57% of the independently published statewide total in 2025–2026, compared with 0.71% at the starting endpoint.
This history uses each year's original annual file linked through the Colorado Department of Education's membership collection. It does not substitute later landing-page revisions for individual historical totals.
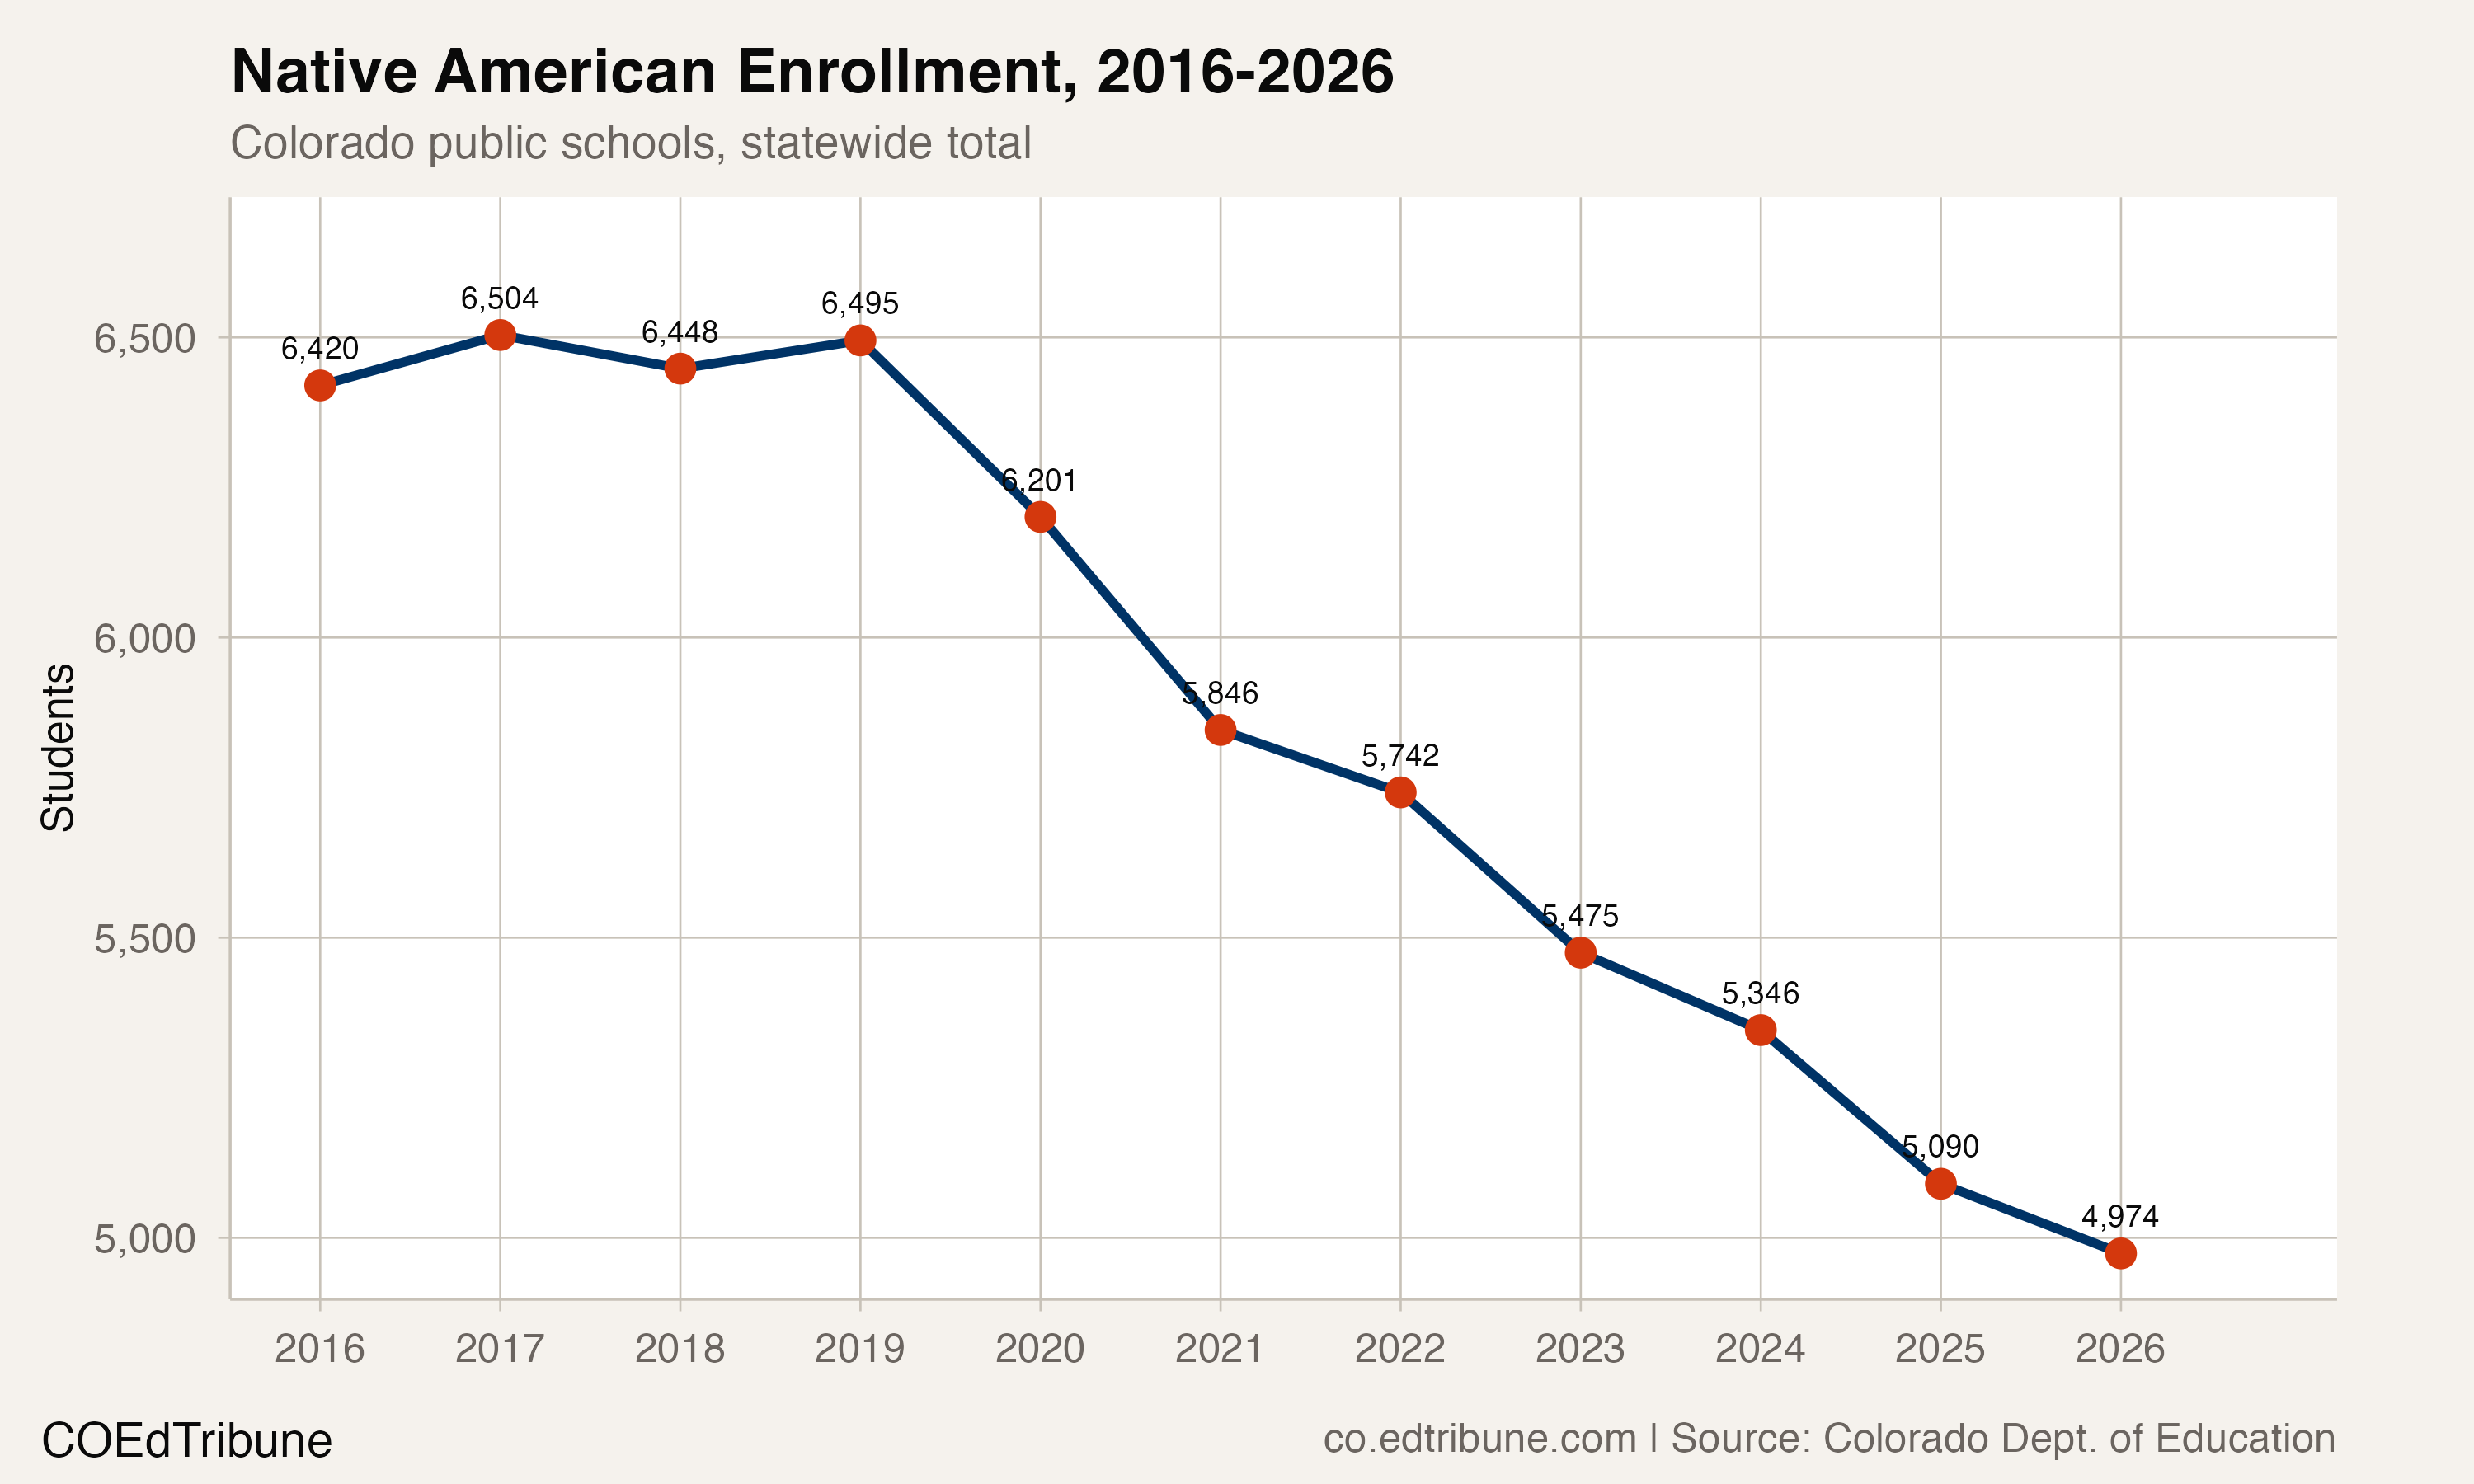
Annual losses continued
Every annual comparison after 2018–2019 was negative: seven consecutive losses through 2025–2026. The total decline from that earlier endpoint was 1,529 students, and the final count was the lowest in the checked window.
Membership fell by 293 students, or 4.5%, in 2019–2020. The following year's loss was 363 students, or 5.8%, the largest annual decline in the checked history. Those annual counts establish the timing and size of the changes. They do not identify which students moved or why a reported category changed.
Percentage and absolute changes differ
White membership fell by 60,456 students, or 12.4%, between 2015–2016 and 2025–2026. That absolute loss was much larger than the Native American loss, although its percentage decline was smaller.
Hispanic membership increased by 16,907 students, or 5.6%, over those same endpoints. Multiracial membership rose from 34,393 to 48,485 students, a gain of 14,092, or 41.0%. Its count increased in every annual comparison in this checked window.
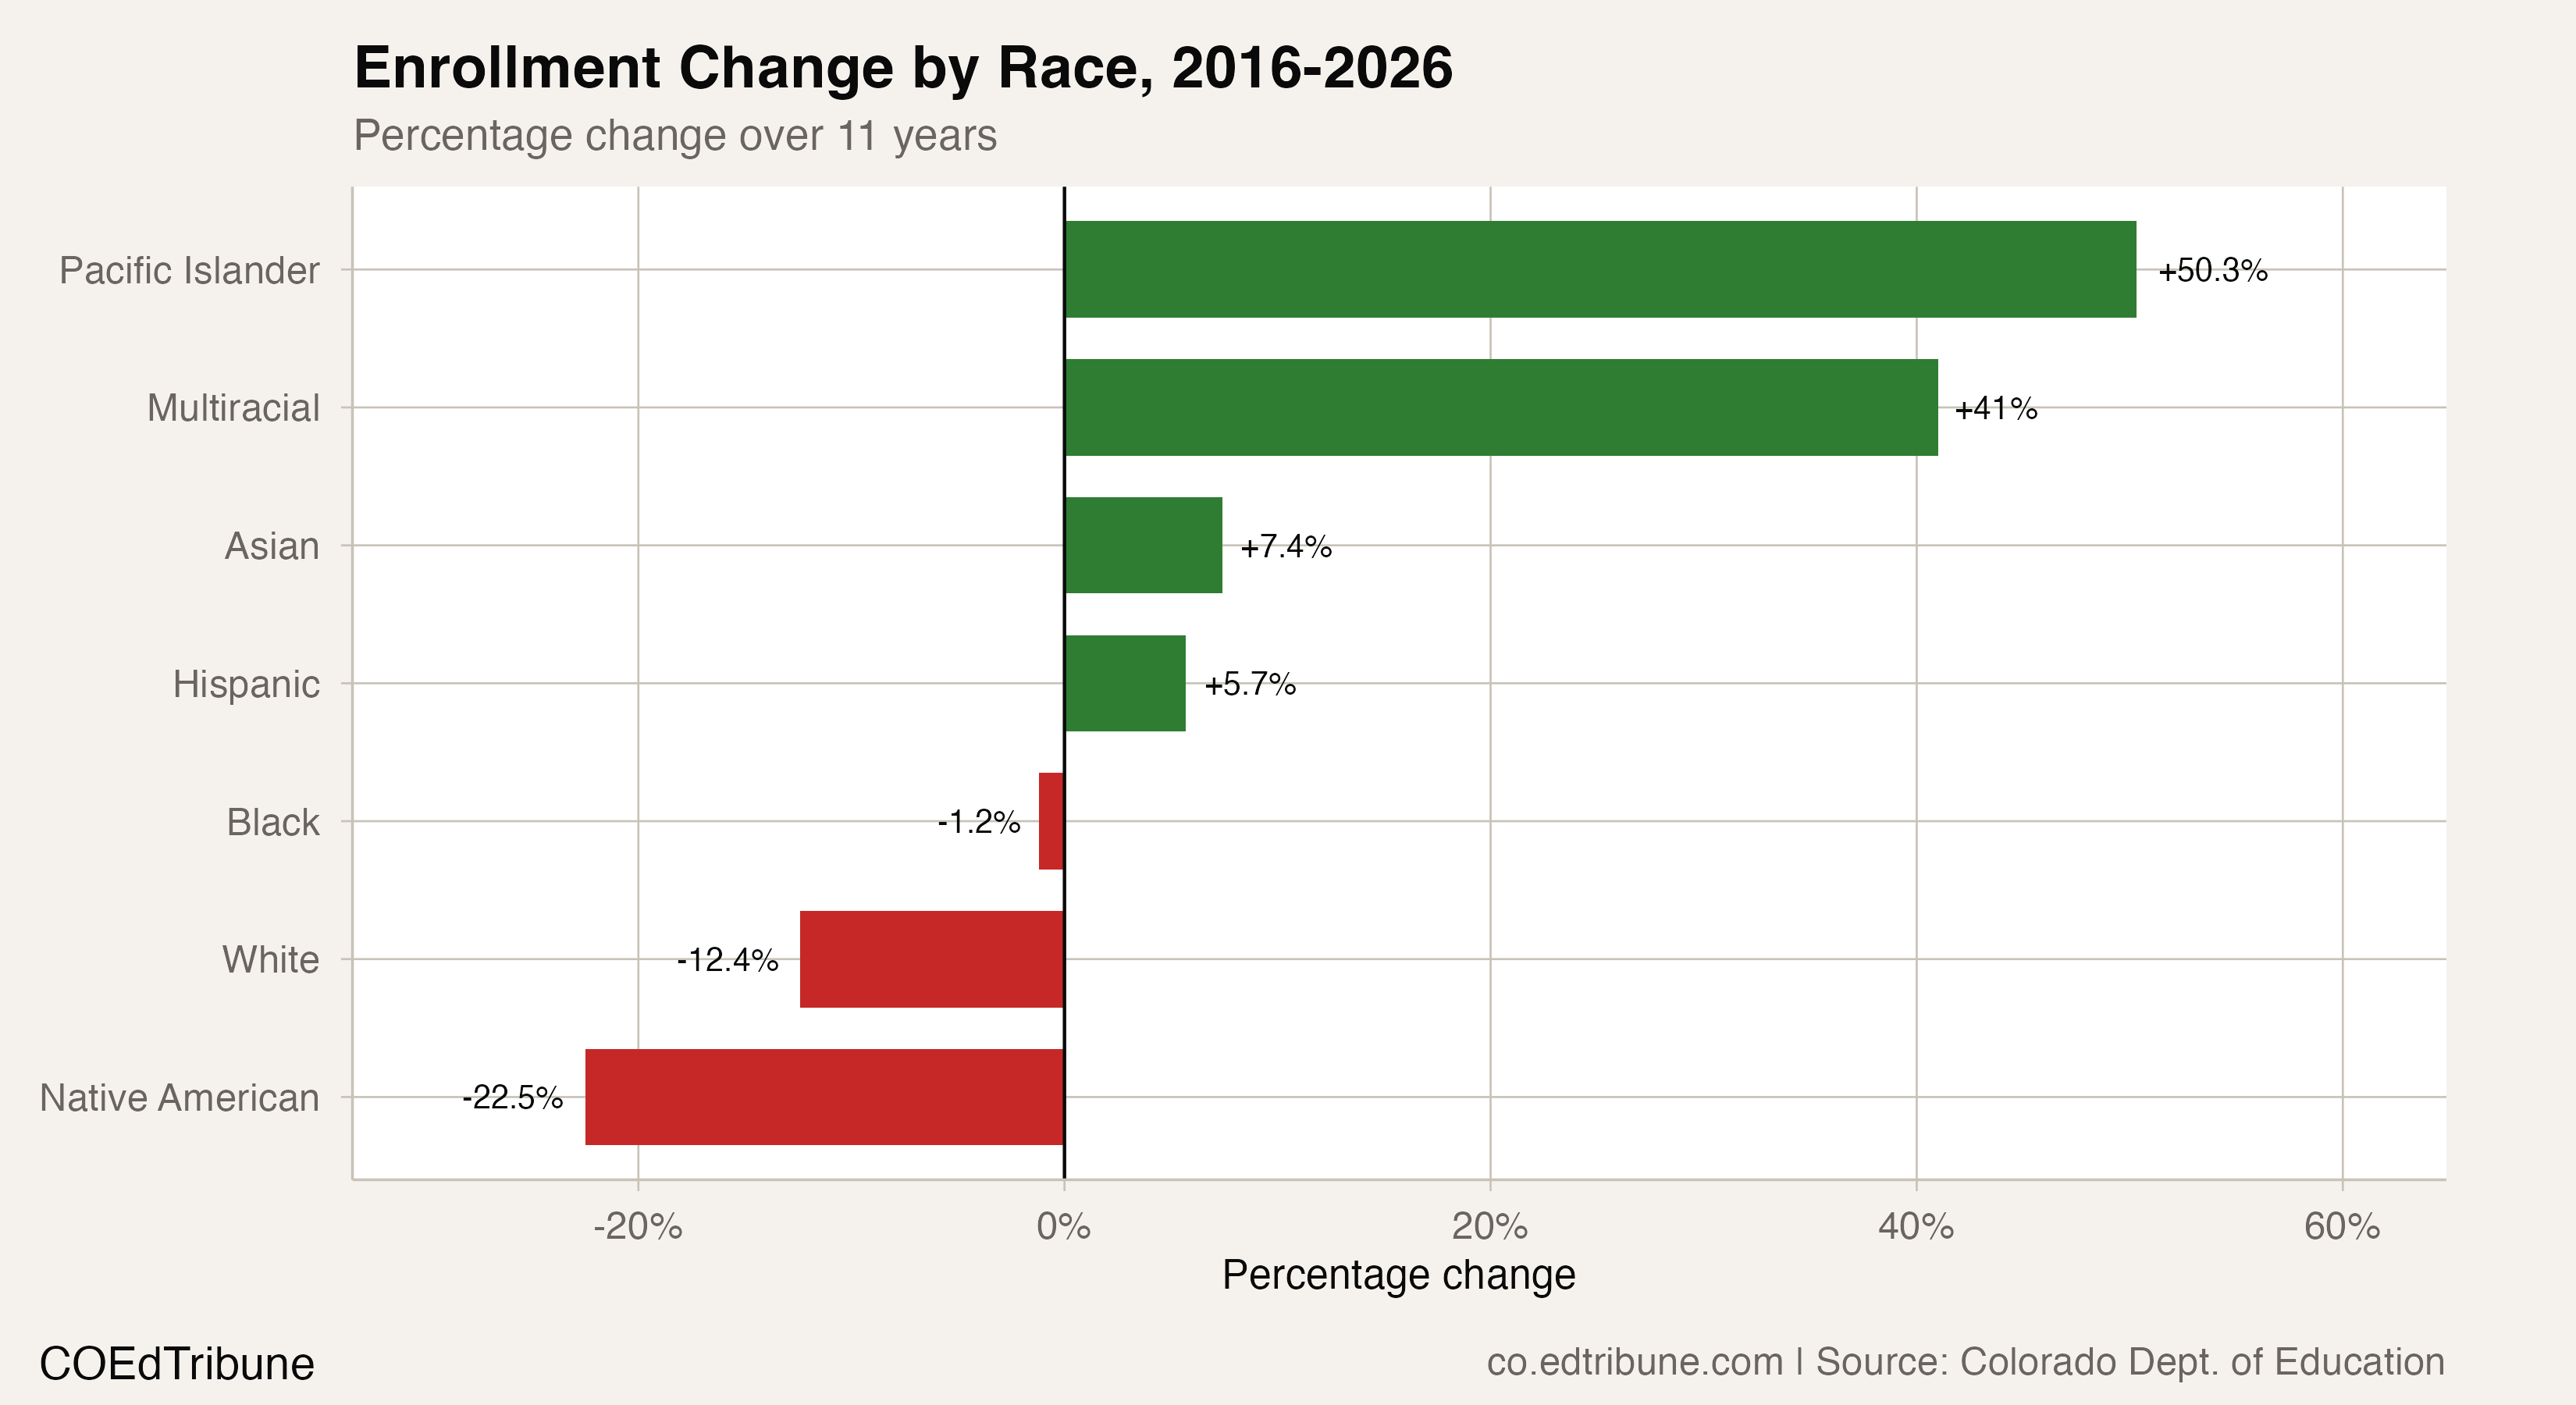
Opposite directions in Native American and multiracial counts do not establish that students switched categories. The annual files record aggregate membership, without a student-level link that would demonstrate such a movement. They also do not measure the contribution of births or departures from public schools.
Selected district histories differed
Montezuma-Cortez RE-1↗ET reported 560 Native American students in 2025–2026, compared with 722 at the starting endpoint, a loss of 162. Those students represented 25.7% of the district's published total last school year.
Ignacio 11 JT↗ET reported 179 Native American students, down from 215, a loss of 36. Its corresponding share was 27.8%. Together, these two districts accounted for 14.9% of Colorado's reported Native American membership, using the published statewide category count as the denominator.
Durango 9-R↗ET moved in the other direction: its count rose from 207 to 245 students, a gain of 38, or 18.4%, over the same endpoints. These selected histories therefore do not support a claim that every district followed the statewide decline.
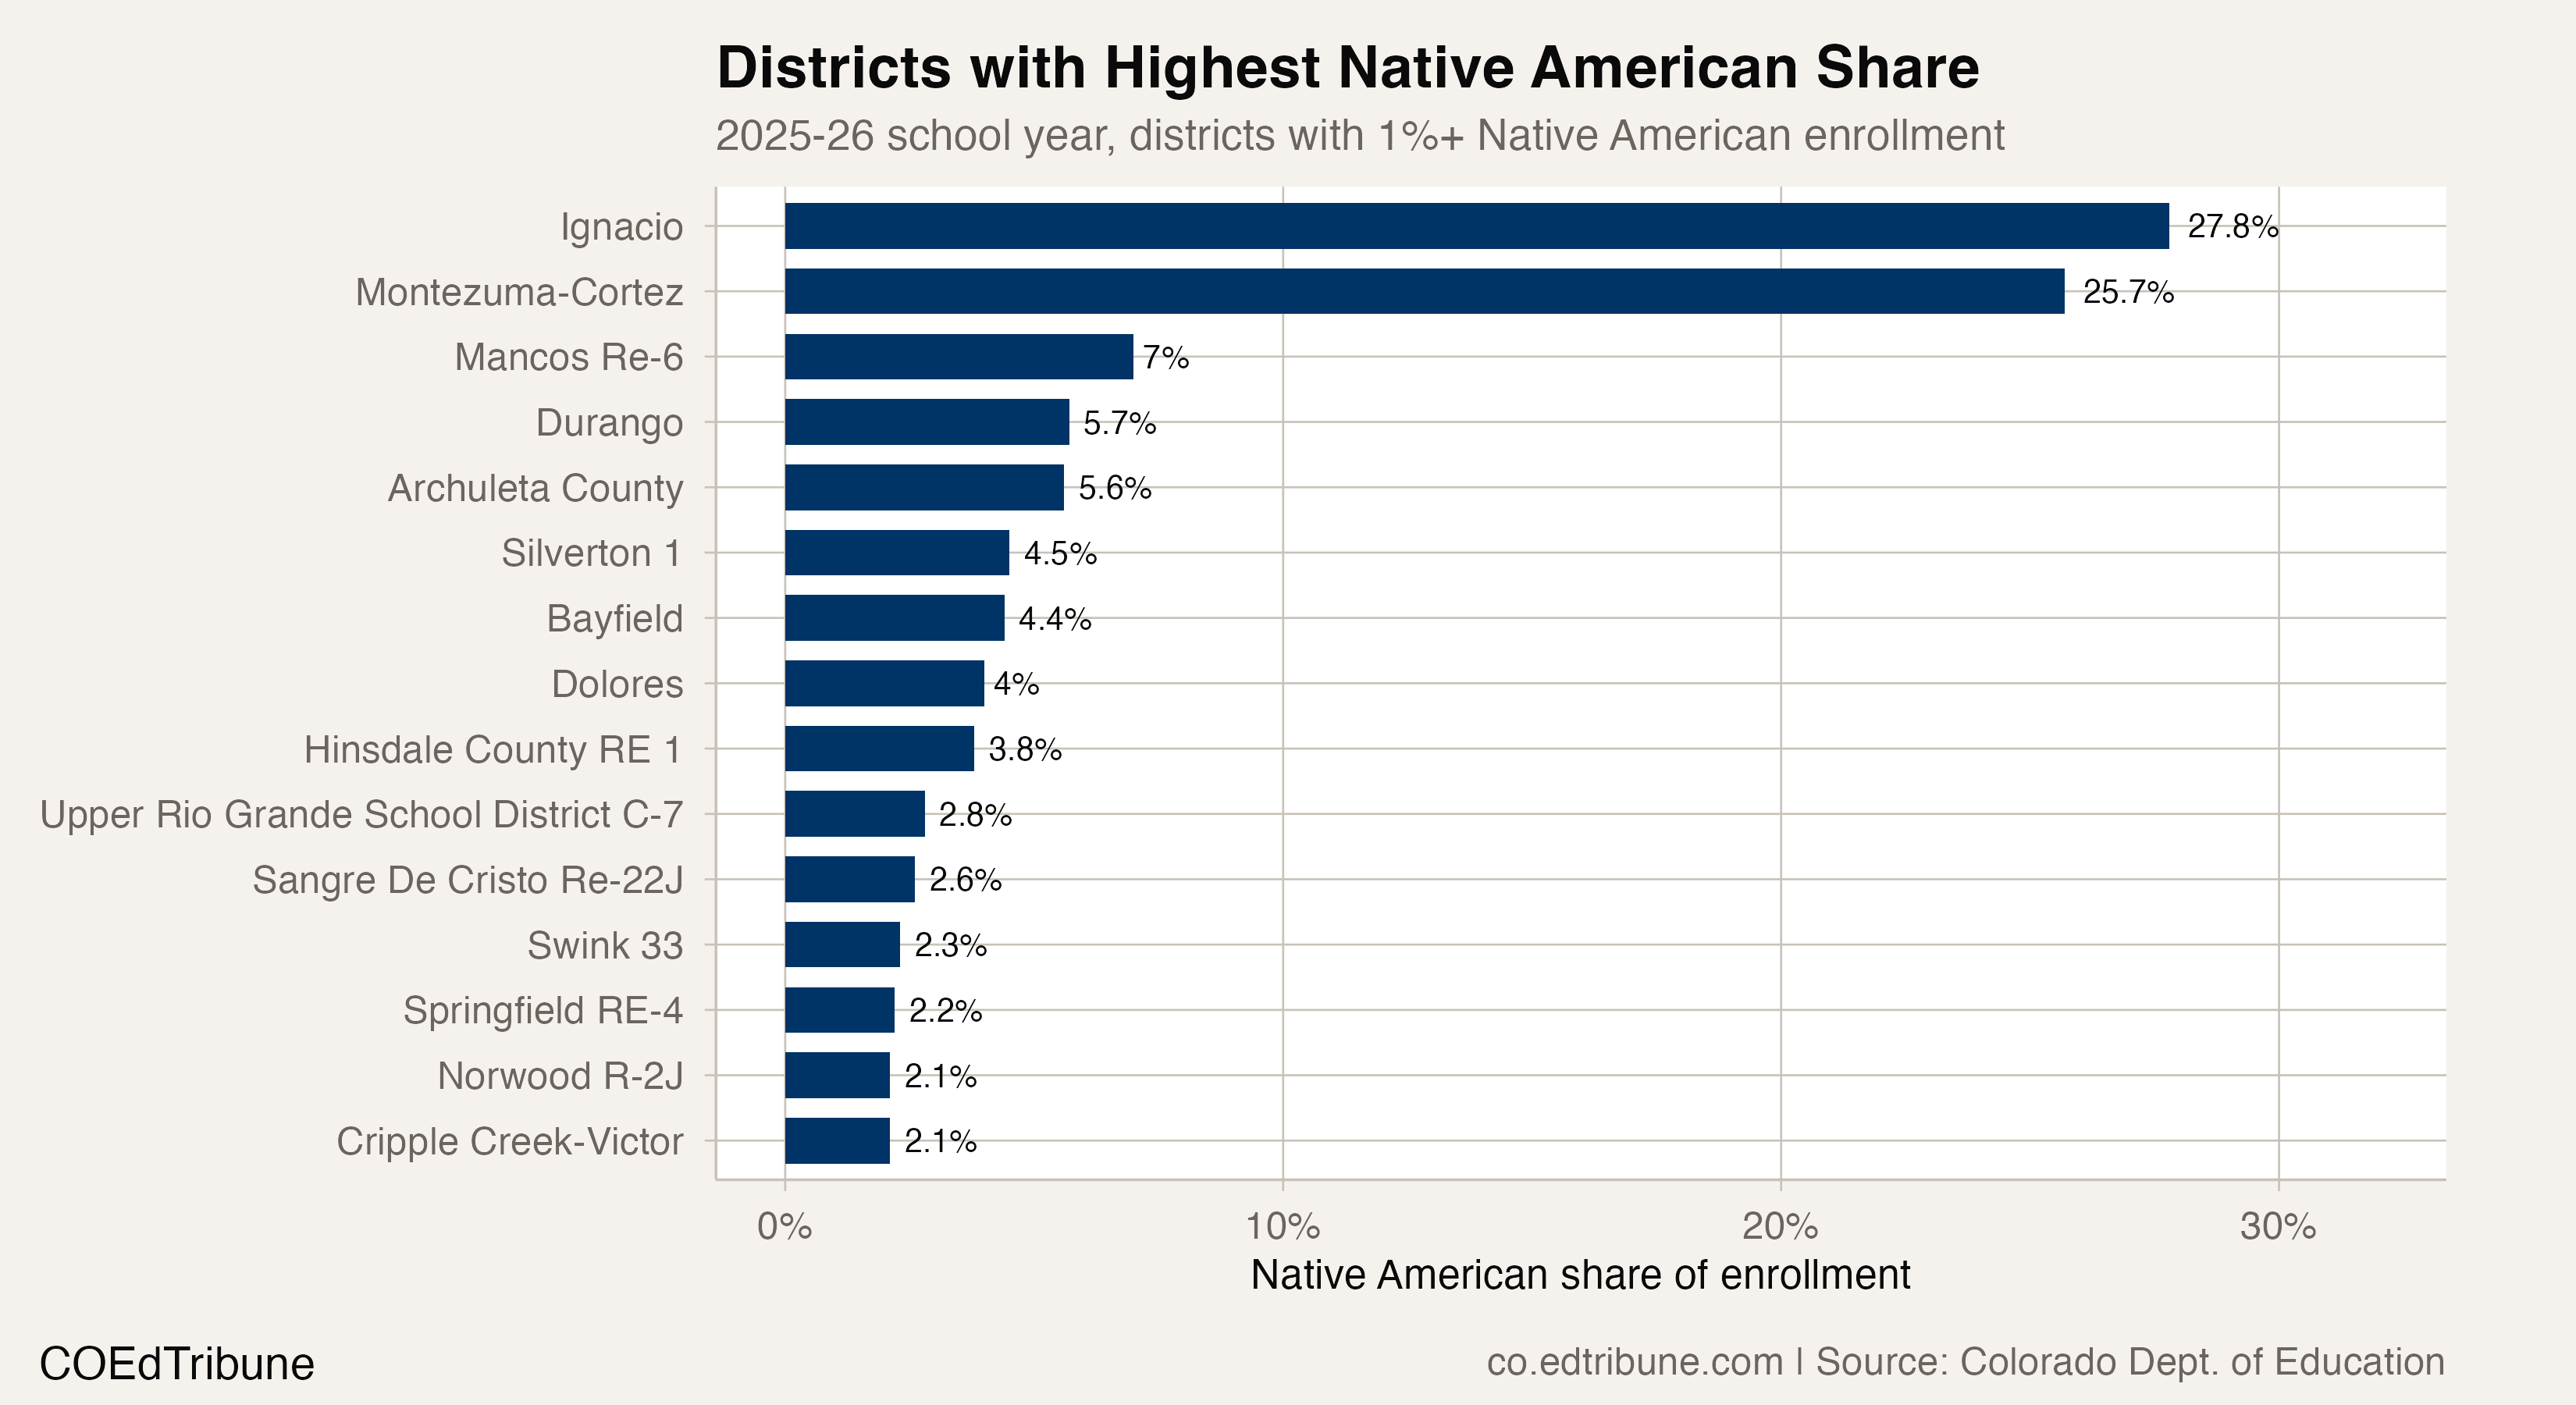
Each district percentage uses that district's independently published total for the corresponding school year. The statewide categories reconcile to published statewide membership throughout the checked window; no selected-category subtotal supplies a denominator.
The records support a substantial decline in reported Native American membership, with different district trajectories. They do not show what caused it, how tribal membership relates to the reported category, or how future counts will change.
Detailed code that reproduces the analysis and figures in this article is available exclusively to EdTribune subscribers.
Discussion
Sign in to join the discussion.
Loading comments...